
Jackson Financial Inc. (JXN): Price and Financial Metrics
JXN Price/Volume Stats
| Current price | $87.84 | 52-week high | $88.12 |
| Prev. close | $85.31 | 52-week low | $31.40 |
| Day low | $86.14 | Volume | 689,303 |
| Day high | $88.12 | Avg. volume | 751,009 |
| 50-day MA | $76.41 | Dividend yield | 3.27% |
| 200-day MA | $59.40 | Market Cap | 6.70B |
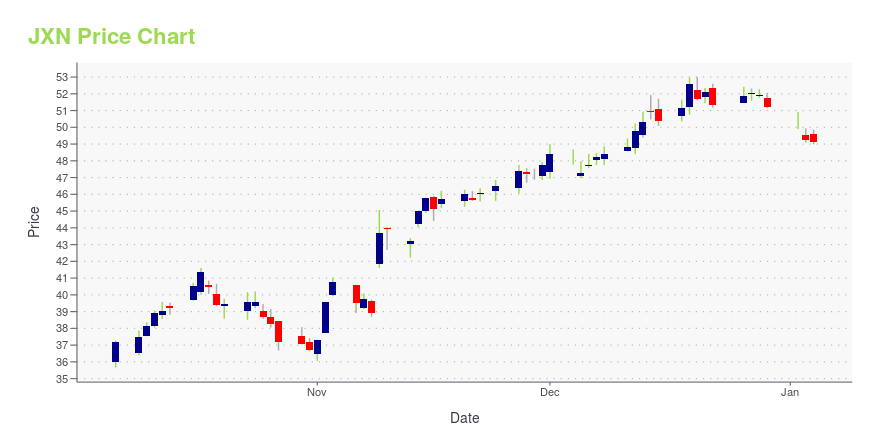
JXN Stock Price Chart Interactive Chart >
Latest JXN News From Around the Web
Below are the latest news stories about JACKSON FINANCIAL INC that investors may wish to consider to help them evaluate JXN as an investment opportunity.
Jackson Enhances Suite of Digital Tools with Launch of Tax Deferral CalculatorLANSING, Mich., December 07, 2023--Jackson National Life Insurance Company (Jackson®), the main operating subsidiary of Jackson Financial Inc.1 (NYSE: JXN), today announced it has launched a proprietary tax deferral calculator available to financial professionals and their clients on Jackson.com. The new tool complements Jackson’s robust suite of online financial planning tools, including its Social Security and retirement expense and income calculators. The tax deferral calculator was developed |
Jackson Awards $770,000 in Biannual Grants to Nonprofits Across Lansing, Nashville and ChicagoLANSING, Mich., December 05, 2023--Jackson National Life Insurance Company® (Jackson®), the main operating subsidiary of Jackson Financial Inc.1 (NYSE: JXN), today announced it has awarded $770,000 to nonprofits serving the communities where Jackson has offices: Lansing, Michigan; Nashville, Tennessee; and Chicago, Illinois. The announcement is part of Jackson’s biannual grant program and brings the company’s total 2023 grant contributions to nearly $1.5 million. The grants support various nonpr |
Jackson’s Scott Golde Honored as Recipient of ThinkAdvisor LUMINARIES 2023 Executive Leadership AwardLANSING, Mich., November 29, 2023--Jackson National Life Insurance Company® (Jackson®), the main operating subsidiary of Jackson Financial Inc.1 (NYSE: JXN), today announced Scott Golde, Senior Vice President, Enterprise Chief Ethics and Compliance Officer, has been named a ThinkAdvisor Executive Leadership 2023 Luminary. Golde was recognized for his significant leadership and continuous efforts to effect change in the insured retirement industry. |
Jackson Study Finds Vast Majority of Investors Inaccurately Predict Life Expectancy, Increasing Risk in Their Retirement Income PlansLANSING, Mich., November 13, 2023--Jackson National Life Insurance Company (Jackson®), the main operating subsidiary of Jackson Financial Inc.1 (NYSE: JXN), today released key findings from its comprehensive study on how retirees and financial professionals perceive retirement risk and the possibility of outliving income. The study is part one of Jackson’s Security in Retirement Series conducted in partnership with the Center for Retirement Research at Boston College. This multi-phase research e |
Jackson Announces Third Quarter 2023 ResultsLANSING, Mich., November 08, 2023--Jackson Financial Inc. (NYSE: JXN) (Jackson®) today announced financial results for the third quarter ended September 30, 2023. |
JXN Price Returns
| 1-mo | 20.59% |
| 3-mo | 27.48% |
| 6-mo | 77.36% |
| 1-year | 184.89% |
| 3-year | N/A |
| 5-year | N/A |
| YTD | 75.28% |
| 2023 | 57.22% |
| 2022 | -11.54% |
| 2021 | N/A |
| 2020 | N/A |
| 2019 | N/A |
JXN Dividends
| Ex-Dividend Date | Type | Payout Amount | Change | ||||||
|---|---|---|---|---|---|---|---|---|---|
| Loading, please wait... | |||||||||
Loading social stream, please wait...