
Kelly Services, Inc. - (KELYA): Price and Financial Metrics
KELYA Price/Volume Stats
| Current price | $23.16 | 52-week high | $25.27 |
| Prev. close | $23.00 | 52-week low | $16.85 |
| Day low | $22.88 | Volume | 148,000 |
| Day high | $23.46 | Avg. volume | 239,056 |
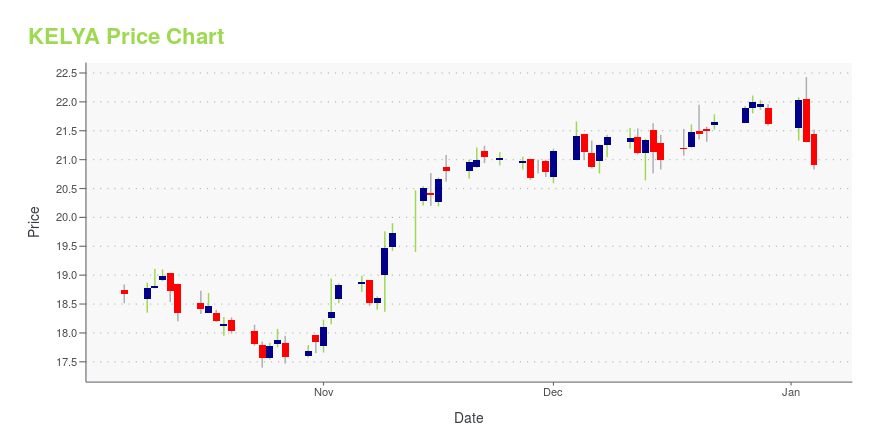
| 50-day MA | $21.81 | Dividend yield | 1.32% |
| 200-day MA | $21.76 | Market Cap | 822.69M |
KELYA Stock Price Chart Interactive Chart >
Kelly Services, Inc. - (KELYA) Company Bio
Kelly Services, Inc. provides workforce solutions to various industries worldwide. It offers trained employees for data entry, clerical, and administrative support roles; staff for contact centers, technical support hotlines, and telemarketing units; instructional and non-instructional employees for schools; support staff for seminars, sales, and trade shows; assemblers, quality control inspectors, and technicians for electronic assembly; maintenance workers, material handlers, and assemblers for industrial light maintenance; and temporary and full-time placement services, as well as direct-hire placement and vendor on-site management services. The company was founded in 1946 and is based in Troy, Michigan.
Latest KELYA News From Around the Web
Below are the latest news stories about KELLY SERVICES INC that investors may wish to consider to help them evaluate KELYA as an investment opportunity.
Senior Vice President Tammy Browning Sells Shares of Kelly Services IncSenior Vice President Tammy Browning sold 18,834 shares of Kelly Services Inc (NASDAQ:KELYA) on December 19, 2023, according to a recent SEC Filing. |
Insider Sell Alert: Senior Vice President Daniel Malan Sells Shares of Kelly Services Inc (KELYA)In a notable insider transaction, Senior Vice President Daniel Malan has parted with 5,475 shares of Kelly Services Inc (NASDAQ:KELYA), a global leader in providing workforce solutions. |
3 Stocks to Buy for a Rebounding Labor MarketIf inflation continues to cool and the Fed holds interest rates (or even cuts them), it would be bullish for a labor market rebound. |
Kelly to Participate in the 19th Annual Noble Capital Markets Emerging Growth Equity ConferenceKelly (Nasdaq: KELYA, KELYB), a leading global specialty talent solutions provider, today announced it will participate in the 19th Annual Noble Capital Markets Emerging Growth Equity Conference at Florida Atlantic University in Boca Raton, Florida, on Monday, December 4, 2023, and Tuesday, December 5, 2023. |
Insider Sell: Executive Vice President Olivier Thirot Sells 30,000 Shares of Kelly Services Inc ...In a notable insider transaction, Executive Vice President Olivier Thirot sold 30,000 shares of Kelly Services Inc (NASDAQ:KELYA) on November 21, 2023. |
KELYA Price Returns
| 1-mo | 8.33% |
| 3-mo | -0.95% |
| 6-mo | 11.37% |
| 1-year | 32.65% |
| 3-year | 10.62% |
| 5-year | -12.48% |
| YTD | 7.82% |
| 2023 | 30.02% |
| 2022 | 2.28% |
| 2021 | -18.05% |
| 2020 | -8.55% |
| 2019 | 11.62% |
KELYA Dividends
| Ex-Dividend Date | Type | Payout Amount | Change | ||||||
|---|---|---|---|---|---|---|---|---|---|
| Loading, please wait... | |||||||||
Continue Researching KELYA
Here are a few links from around the web to help you further your research on Kelly Services Inc's stock as an investment opportunity:Kelly Services Inc (KELYA) Stock Price | Nasdaq
Kelly Services Inc (KELYA) Stock Quote, History and News - Yahoo Finance
Kelly Services Inc (KELYA) Stock Price and Basic Information | MarketWatch
Loading social stream, please wait...