Kenon Holdings Ltd. Ordinary Shares (KEN): Price and Financial Metrics
GET POWR RATINGS... FREE!
KEN POWR Grades
- KEN scores best on the Momentum dimension, with a Momentum rank ahead of 87.7% of US stocks.
- The strongest trend for KEN is in Stability, which has been heading up over the past 177 days.
- KEN ranks lowest in Quality; there it ranks in the 29th percentile.
KEN Stock Summary
- With a price/earnings ratio of 1.16, KENON HOLDINGS LTD P/E ratio is greater than that of about merely 0.82% of stocks in our set with positive earnings.
- The ratio of debt to operating expenses for KENON HOLDINGS LTD is higher than it is for about 94.28% of US stocks.
- Shareholder yield, a measure of how much is returned to shareholders via dividends and share repurchases, for KEN comes in at 58.51% -- higher than that of 97.4% of stocks in our set.
- Stocks with similar financial metrics, market capitalization, and price volatility to KENON HOLDINGS LTD are AMTX, VCTR, PCH, CLMT, and TH.
- Visit KEN's SEC page to see the company's official filings. To visit the company's web site, go to www.kenon-holdings.com.
KEN Valuation Summary
- KEN's price/earnings ratio is 1.1; this is 94.81% lower than that of the median Utilities stock.
- Over the past 83 months, KEN's price/earnings ratio has gone down 4.8.
Below are key valuation metrics over time for KEN.
Stock | Date | P/S | P/B | P/E | EV/EBIT |
---|---|---|---|---|---|
KEN | 2023-01-27 | 2.9 | 0.7 | 1.1 | 1.4 |
KEN | 2023-01-26 | 3.0 | 0.7 | 1.1 | 1.4 |
KEN | 2023-01-25 | 3.1 | 0.7 | 1.1 | 1.4 |
KEN | 2023-01-24 | 3.1 | 0.7 | 1.1 | 1.4 |
KEN | 2023-01-23 | 3.3 | 0.8 | 1.2 | 1.5 |
KEN | 2023-01-20 | 3.2 | 0.8 | 1.2 | 1.5 |
KEN Growth Metrics
- Its 3 year net income to common stockholders growth rate is now at 1231.45%.
- Its 3 year cash and equivalents growth rate is now at 345.96%.
- Its 4 year revenue growth rate is now at -81.69%.

The table below shows KEN's growth in key financial areas (numbers in millions of US dollars).
Date | Revenue | Operating Cash Flow | Net Income to Common Stock |
---|---|---|---|
2022-09-30 | 564.763 | 830.529 | 1,547.273 |
2022-06-30 | 534.763 | 750.529 | 1,482.273 |
2022-03-31 | 518.763 | 236.529 | 1,389.273 |
2021-12-31 | 487.763 | 240.529 | 930.273 |
2021-12-31 | 488 | 240 | 930 |
2021-09-30 | 457.47 | 142.196 | 683.106 |
KEN's Quality Factors
The “Quality” component of the POWR Ratings focuses on 31 different factors of a companies fundamentals and operational strength. Here are some key insights as we drill into the specifics of these quality attributes.- KEN has a Quality Grade of D, ranking ahead of 11.91% of graded US stocks.
- KEN's asset turnover comes in at 0.162 -- ranking 80th of 105 Utilities stocks.
- WES, CQP, and LNG are the stocks whose asset turnover ratios are most correlated with KEN.
The table below shows KEN's key quality metrics over time.
Period | Asset Turnover | Gross Margin | ROIC |
---|---|---|---|
2021-06-30 | 0.162 | 0.166 | 0.215 |
2021-03-31 | 0.172 | 0.173 | 0.290 |
2020-12-31 | 0.194 | 0.184 | 0.260 |
2020-12-31 | 0.194 | 0.184 | 0.260 |
2020-09-30 | 0.212 | 0.211 | 0.188 |
2020-06-30 | 0.215 | 0.222 | 0.175 |
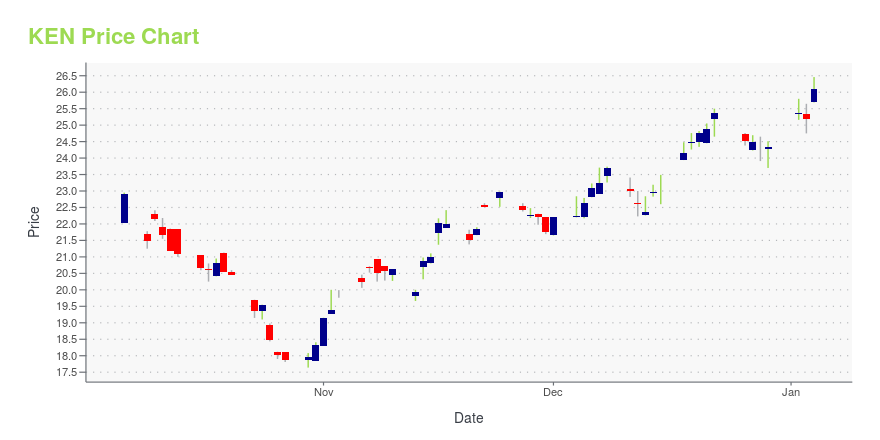
KEN Stock Price Chart Interactive Chart >
KEN Price/Volume Stats
Current price | $32.81 | 52-week high | $72.90 |
Prev. close | $33.28 | 52-week low | $30.24 |
Day low | $32.49 | Volume | 27,800 |
Day high | $33.33 | Avg. volume | 23,043 |
50-day MA | $33.49 | Dividend yield | N/A |
200-day MA | $41.78 | Market Cap | 1.77B |
Kenon Holdings Ltd. Ordinary Shares (KEN) Company Bio
The Company is primarily engaged in the operation of two businesses: IC Power Ltd. (IC Power), a wholly owned power generation company, and Qoros Automotive Co., Ltd. (Qoros), a China-based automotive company, in which it has a 50% equity interest. The company is based in Singapore.
Latest KEN News From Around the Web
Below are the latest news stories about KENON HOLDINGS LTD that investors may wish to consider to help them evaluate KEN as an investment opportunity.
7 Safe High-Yield Dividend Stocks to BuyInvesting in safe high-yield dividend stocks is a good way to protect yourself as the economy slips closer to a recession. |
11 Best Commodity Stocks To Buy on the DipIn this article, we discuss the 11 best commodity stocks to buy on the dip. If you want to read about some more commodity stocks to buy on the dip, go directly to 5 Best Commodity Stocks To Buy on the Dip. Over the past year, commodities stocks were trading at record highs due to […] |
11 Best Commodity Stocks To Buy NowIn this article, we discuss the 11 best commodity stocks to buy now. If you want to read about some more commodity stocks to buy now, go directly to 5 Best Commodity Stocks To Buy Now. Commodities are often split into broad categories like hard and soft commodities. Natural resources are included in hard commodities […] |
Kenon Holdings Reports Q3 2022 Results and Additional UpdatesSINGAPORE, Nov. 30, 2022 /PRNewswire/ -- Kenon Holdings Ltd. (NYSE: KEN) (TASE: KEN) ("Kenon") announces its results for Q3 2022 and additional updates. Q3 and Recent Highlights OPC Financial results: OPC''s net profit in Q3 2022 was $33 million, as compared to a net loss of $33 million in… |
As Fossil Fuels Phase Out, These 3 Renewable Energy Companies Tout Soaring YieldsRussia''s invasion of Ukraine has created volatility in the crude oil market and hurt consumers . After all, oil and gas prices have increased to levels unseen since the 2008 financial crisis. As a result, this may speed up the shift to renewable energy sources . Here are three firms with soaring yields in the renewables space: Also Read: Solar Power Is Taking Off In Europe During Energy Crisis: Here Are Two Companies To Look At Kenon Holdings Ltd. (NYSE: KEN ) is offering a dividend yield of 27.64% or $10.25 per share making annual payments, with an inconsistent track record of increasing its dividend payments. The Singapore-based company owns a 59% equity interest stake in OPC Energy, a developer and operator of power generation facilities in the Israeli and U.S. power markets. Kenon ... |
KEN Price Returns
1-mo | 4.82% |
3-mo | -13.09% |
6-mo | -27.48% |
1-year | -41.08% |
3-year | 121.37% |
5-year | 181.27% |
YTD | -0.58% |
2022 | -32.88% |
2021 | 93.65% |
2020 | 57.16% |
2019 | 50.73% |
2018 | 23.06% |
Continue Researching KEN
Want to do more research on Kenon Holdings Ltd's stock and its price? Try the links below:Kenon Holdings Ltd (KEN) Stock Price | Nasdaq
Kenon Holdings Ltd (KEN) Stock Quote, History and News - Yahoo Finance
Kenon Holdings Ltd (KEN) Stock Price and Basic Information | MarketWatch
Loading social stream, please wait...