
Kewaunee Scientific Corporation (KEQU): Price and Financial Metrics
KEQU Price/Volume Stats
| Current price | $53.41 | 52-week high | $54.71 |
| Prev. close | $54.07 | 52-week low | $14.95 |
| Day low | $53.01 | Volume | 18,011 |
| Day high | $54.71 | Avg. volume | 13,251 |
| 50-day MA | $43.43 | Dividend yield | N/A |
| 200-day MA | $31.20 | Market Cap | 151.68M |
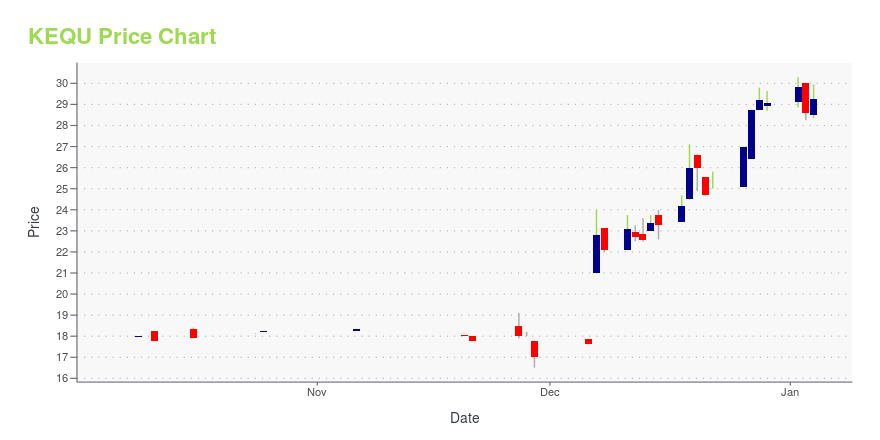
KEQU Stock Price Chart Interactive Chart >
Kewaunee Scientific Corporation (KEQU) Company Bio
Kewaunee Scientific Corporation designs, manufactures, and installs laboratory, healthcare, and technical furniture products. The company was founded in 1906 and is based in Statesville, North Carolina.
Latest KEQU News From Around the Web
Below are the latest news stories about KEWAUNEE SCIENTIFIC CORP that investors may wish to consider to help them evaluate KEQU as an investment opportunity.
Insider Buying: Director John Russell Acquires 7,500 Shares of Kewaunee Scientific CorpIn the realm of stock market movements, insider trading activity is often a significant indicator that can provide insights into a company's potential future performance. |
Insider Sell Alert: President and CEO HULL THOMAS DAVID III Sells 6,000 Shares of Kewaunee ...In a recent transaction on December 13, 2023, HULL THOMAS DAVID III, the President and CEO of Kewaunee Scientific Corp (NASDAQ:KEQU), sold 6,000 shares of the company's stock. |
Kewaunee Scientific Corporation's (NASDAQ:KEQU) Fundamentals Look Pretty Strong: Could The Market Be Wrong About The Stock?It is hard to get excited after looking at Kewaunee Scientific's (NASDAQ:KEQU) recent performance, when its stock has... |
Kewaunee Scientific Reports Results for Second Quarter of Fiscal Year 2024Kewaunee Scientific Corporation (NASDAQ: KEQU) today announced results for its second quarter ended October 31, 2023. |
Kewaunee Scientific to Report Results for Second Quarter Fiscal Year 2024Kewaunee Scientific Corporation (NASDAQ: KEQU) today announced that the Company plans to release its second quarter fiscal year 2024 financial results on Wednesday, December 6, 2023 after the close of trading. This information will be available on the Company's website www.kewaunee.com after the release. |
KEQU Price Returns
| 1-mo | 37.87% |
| 3-mo | 53.04% |
| 6-mo | 83.86% |
| 1-year | 257.26% |
| 3-year | 302.79% |
| 5-year | 198.58% |
| YTD | 83.73% |
| 2023 | N/A |
| 2022 | 0.00% |
| 2021 | 1.57% |
| 2020 | -7.04% |
| 2019 | -58.34% |
Continue Researching KEQU
Want to see what other sources are saying about Kewaunee Scientific Corp's financials and stock price? Try the links below:Kewaunee Scientific Corp (KEQU) Stock Price | Nasdaq
Kewaunee Scientific Corp (KEQU) Stock Quote, History and News - Yahoo Finance
Kewaunee Scientific Corp (KEQU) Stock Price and Basic Information | MarketWatch
Loading social stream, please wait...