
Kirby Corporation (KEX): Price and Financial Metrics
KEX Price/Volume Stats
| Current price | $119.44 | 52-week high | $130.90 |
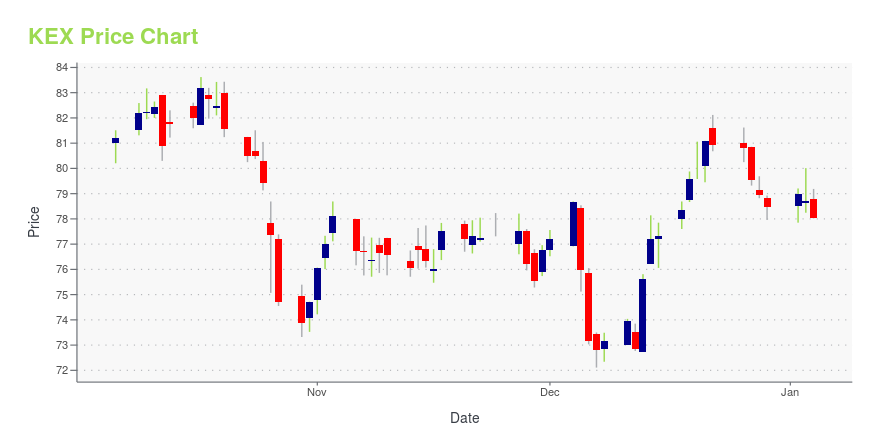
| Prev. close | $117.96 | 52-week low | $72.11 |
| Day low | $118.76 | Volume | 309,365 |
| Day high | $120.80 | Avg. volume | 453,137 |
| 50-day MA | $120.43 | Dividend yield | N/A |
| 200-day MA | $94.69 | Market Cap | 6.99B |
KEX Stock Price Chart Interactive Chart >
Kirby Corporation (KEX) Company Bio
Kirby Corporation transports petrochemicals, black oil, refined petroleum products and agricultural chemicals by tank barge. The company was founded in 1921 and is based in Houston, Texas.
Latest KEX News From Around the Web
Below are the latest news stories about KIRBY CORP that investors may wish to consider to help them evaluate KEX as an investment opportunity.
Investors Still Waiting For A Pull Back In Kirby Corporation (NYSE:KEX)When close to half the companies in the United States have price-to-earnings ratios (or "P/E's") below 16x, you may... |
Here's Why Investors Should Retain Kirby (KEX) Stock NowStrong segmental performance and its cash-generating ability boost Kirby (KEX). |
13 Best Shipping and Container Stocks To BuyIn this article, we will take a look at the 13 best shipping and container stocks to buy. To skip our recent market trends and activity analysis, you can go directly to see the 5 Best Shipping and Container Stocks to Buy. The usually inconspicuous realm of shipping stocks gained prominence during the COVID-19 pandemic, […] |
There's Been No Shortage Of Growth Recently For Kirby's (NYSE:KEX) Returns On CapitalIf we want to find a stock that could multiply over the long term, what are the underlying trends we should look for... |
Kirby Corporation to Present at the Stephens NASH2023 Investment ConferenceHOUSTON, Nov. 09, 2023 (GLOBE NEWSWIRE) -- Kirby Corporation ("Kirby" or “the Company”) (NYSE: KEX) announced today that Kirby will present in a fireside chat at the Stephens NASH2023 Investment Conference on Tuesday, November 14, 2023. Specifics of the conference presentation are as follows: Stephens NASH2023 Investment ConferenceDate:Tuesday, November 14, 2023Time:9:00 a.m. Eastern / 8:00 a.m. CentralPresenters:Raj Kumar, Executive Vice President and CFOKurt Niemietz, VP IR & TreasurerModerato |
KEX Price Returns
| 1-mo | 0.12% |
| 3-mo | 6.64% |
| 6-mo | 49.62% |
| 1-year | 48.63% |
| 3-year | 103.06% |
| 5-year | 56.60% |
| YTD | 52.19% |
| 2023 | 21.96% |
| 2022 | 8.30% |
| 2021 | 14.64% |
| 2020 | -42.11% |
| 2019 | 32.91% |
Continue Researching KEX
Here are a few links from around the web to help you further your research on Kirby Corp's stock as an investment opportunity:Kirby Corp (KEX) Stock Price | Nasdaq
Kirby Corp (KEX) Stock Quote, History and News - Yahoo Finance
Kirby Corp (KEX) Stock Price and Basic Information | MarketWatch
Loading social stream, please wait...