
Kamada Ltd. (KMDA): Price and Financial Metrics
KMDA Price/Volume Stats
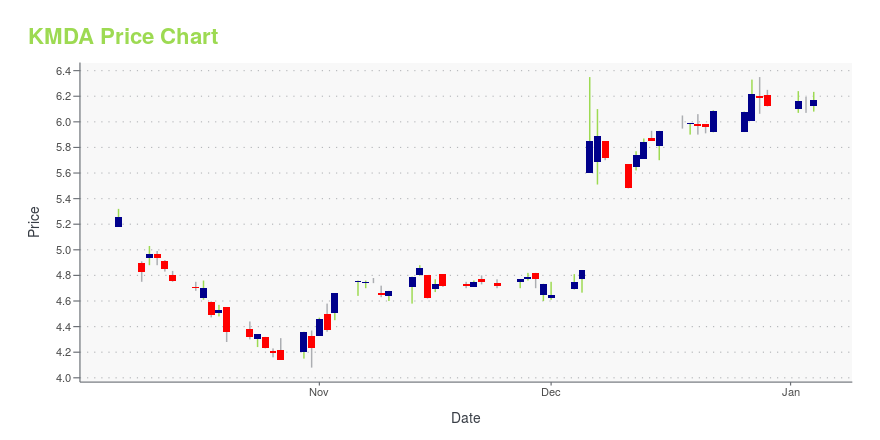
| Current price | $5.94 | 52-week high | $6.53 |
| Prev. close | $5.94 | 52-week low | $4.08 |
| Day low | $5.87 | Volume | 26,823 |
| Day high | $6.10 | Avg. volume | 25,117 |
| 50-day MA | $5.40 | Dividend yield | N/A |
| 200-day MA | $5.44 | Market Cap | 341.43M |
KMDA Stock Price Chart Interactive Chart >
Kamada Ltd. (KMDA) Company Bio
Kamada Ltd. develops, produces, and markets specialty plasma-derived protein therapeutics. It operates through two segments, Proprietary Products and Distribution. The company was founded in 1990 and is based in Ness Ziona, Israel.
Latest KMDA News From Around the Web
Below are the latest news stories about KAMADA LTD that investors may wish to consider to help them evaluate KMDA as an investment opportunity.
KEDRION ANNOUNCES AN EIGHT-YEAR EXTENSION OF THE DISTRIBUTION AGREEMENT WITH KAMADA IN THE US FOR KEDRAB®Kedrion Biopharma, a leading global biopharmaceutical company that develops, manufactures and commercializes therapeutic products derived from blood plasma, announces the execution of a binding memorandum of understanding with Kamada Ltd. (NASDAQ: KMDA; TASE: KMDA.TA), an Israeli commercial stage global biopharmaceutical company and leader in the specialty plasma-derived field, for the amendment and the 8-year extension of the KEDRAB® US distribution agreement between the two companies. |
KMDA: Amendment and Extension of Kedrab® U.S. Distribution Agreement to Generate at Least $180 Million Over First Four Years…By David Bautz, PhD NASDAQ:KMDA READ THE FULL KMDA RESEARCH REPORT Business Update On December 6, 2023, Kamada Ltd. (NASDAQ:KMDA) announced the execution of a binding memorandum of understanding with Kedrion for an amendment and extension of the company’s U.S. distribution agreement for Kedrab, a human rabies immune globulin indicated for the transient post-exposure prophylaxis of rabies |
Kamada Announces its Largest Commercial Agreement; A Strategic Engagement with Kedrion for U.S. Distribution of KEDRAB® including $180 Million of Revenues Over First Four YearsLargest Commercial Agreement in Kamada’s History Becomes Effective in January 2024 and Includes $180 Million of Revenues to Kamada Over the First Four Years of the Eight Year TermFinancial Terms Reflect KEDRAB®'s Significant U.S. Market Share and Continued Growth Through the Eight Year TermAgreement Includes Potential Expansion of Kedrion’s Distribution of KEDRAB in Additional Territories Beyond the U.S.Kamada to Host a Conference Call and Live Webcast Today at 8:30 AM ET REHOVOT, Israel and HOB |
KMDA: $37.9 Million in 3Q23 Revenues; Closes $60 Million Private Placement with FIMI Opportunity Funds…By David Bautz, PhD NASDAQ:KMDA READ THE FULL KMDA RESEARCH REPORT Financial Update On November 13, 2023, Kamada Ltd. (NASDAQ:KMDA) announced financial results for the third quarter of 2023. Kamada reported revenues of $37.9 million, which was a 18% increase over the third quarter of 2022. The revenue consisted of $31.4 million from proprietary products and $6.5 million from the distribution |
Kamada Reports Significant Increase in Sales and Profitability in the Third Quarter and Nine Month 2023; Reiterates 2023 Revenue and Profitability GuidanceThird Quarter 2023 Revenues were $37.9 Million Representing an 18% Increase Year-over-Year; Nine Month 2023 Revenues of $106.1 Million, Up 26% Year-over-YearThird Quarter 2023 Adjusted EBITDA of $7.9 Million Representing a 31% Increase Year-over-Year; Nine Month 2023 Adjusted EBITDA of $17.7 Million, Up 67% Year-over-YearStrong Third Quarter Results and Positive Outlook for Fourth Quarter Support Reiteration of Fiscal Year 2023 Revenue and Adjusted EBITDA Guidance Multiple Recent Achievements wi |
KMDA Price Returns
| 1-mo | 18.80% |
| 3-mo | 15.34% |
| 6-mo | 3.48% |
| 1-year | 22.22% |
| 3-year | 9.19% |
| 5-year | 2.77% |
| YTD | -2.94% |
| 2023 | 52.62% |
| 2022 | -39.06% |
| 2021 | 1.54% |
| 2020 | -5.12% |
| 2019 | 36.60% |
Continue Researching KMDA
Want to see what other sources are saying about Kamada Ltd's financials and stock price? Try the links below:Kamada Ltd (KMDA) Stock Price | Nasdaq
Kamada Ltd (KMDA) Stock Quote, History and News - Yahoo Finance
Kamada Ltd (KMDA) Stock Price and Basic Information | MarketWatch
Loading social stream, please wait...