
Kandi Technologies Group, Inc. (KNDI): Price and Financial Metrics
KNDI Price/Volume Stats
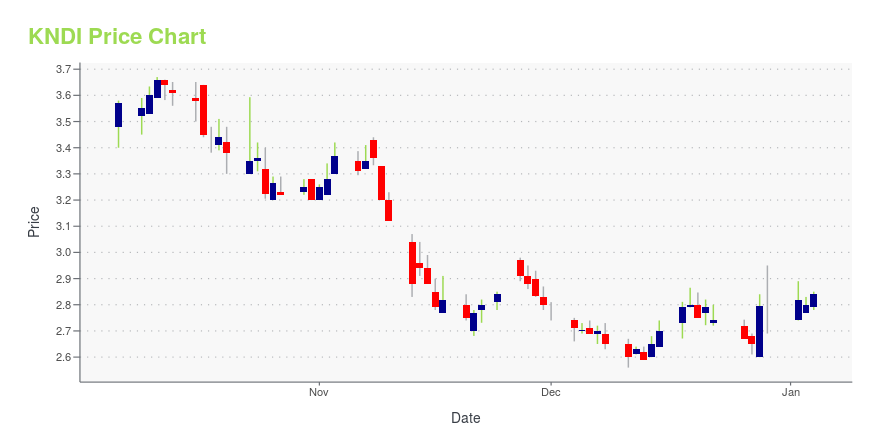
| Current price | $1.92 | 52-week high | $3.74 |
| Prev. close | $1.87 | 52-week low | $1.76 |
| Day low | $1.87 | Volume | 36,000 |
| Day high | $1.92 | Avg. volume | 95,608 |
| 50-day MA | $2.02 | Dividend yield | N/A |
| 200-day MA | $2.52 | Market Cap | 167.29M |
KNDI Stock Price Chart Interactive Chart >
Kandi Technologies Group, Inc. (KNDI) Company Bio
Kandi Technologies Group designs, develops, manufactures, and commercializes electric vehicles (EVs), EV parts, and off-road vehicles in China and internationally. The company was founded in 2004 and is based in Jinhua, China.
Latest KNDI News From Around the Web
Below are the latest news stories about KANDI TECHNOLOGIES GROUP INC that investors may wish to consider to help them evaluate KNDI as an investment opportunity.
Kandi Technologies Announces Share Buyback of Up to $30 MillionJINHUA, CHINA, Nov. 27, 2023 (GLOBE NEWSWIRE) -- Kandi Technologies Group, Inc. (“Kandi” or “the Company”) (NASDAQ GS: KNDI), today announced that its Board of Director has authorized a stock repurchase program (the “repurchase program”) to purchase up to $30 million of the Company’s common stock. The repurchase program is expected to be completed by the end of 2024, with progress updates disclosed in its quarterly reports on Form 10-Q and its annual reports on Form 10-K covering the periods dur |
Kandi’s First 500 Fully Electric Mini Golf Carts to Launch in US MarketJINHUA, CHINA, Nov. 15, 2023 (GLOBE NEWSWIRE) -- JINHUA, CHINA-- (November 15, 2023) - Kandi Technologies Group, Inc. (the “Company,” “we” or “Kandi”) (NASDAQ GS: KNDI), today announced that its first batch of 500 all-electric mini golf carts has arrived in the United States and will be gradually released in the market starting this month. Designed by American professionals, the carts were meticulously developed and manufactured by Kandi. Among other features, these models boast electric telesco |
Kandi America Partners with Peavey Mart to Expand Kandi Products into CanadaJINHUA, CHINA, Nov. 13, 2023 (GLOBE NEWSWIRE) -- Kandi Technologies Group, Inc. (the “Company,” “we” or “Kandi”) (NASDAQ GS: KNDI), today announced that its wholly owned subsidiary SC Autosports, LLC (“SC Autosports” or “Kandi America”) has strategically partnered with Peavey Mart, a leading farm and ranch retailer with over 270 locations across Canada. Peavey Mart goes to market under both the ACE Hardware Canada and Tractor Supply brands. Both Peavey and Kandi are dedicated to quality and cust |
Kandi Technologies Group, Inc. (NASDAQ:KNDI) Q3 2023 Earnings Call TranscriptKandi Technologies Group, Inc. (NASDAQ:KNDI) Q3 2023 Earnings Call Transcript November 8, 2023 Operator: Greetings, and welcome to the Kandi Technologies Third Quarter 2023 Financial Results Call. At this time, all participants are in a listen-only mode. A brief question-and-answer session will follow the formal presentation. [Operator Instructions] As a reminder, this conference is being […] |
Kandi Technologies Reports Third Quarter 2023 Financial Results- Product Transformation Initiative Driving Profit Growth - Nine-month Net Income of $6.3 Million, Diluted EPS of $0.08 JINHUA, China, Nov. 08, 2023 (GLOBE NEWSWIRE) -- Kandi Technologies Group, Inc. (the “Company”, “we” or “Kandi”) (NASDAQ GS: KNDI), today announced its financial results for the third quarter of 2023. Third Quarter and Nine Months 2023 Financial Highlights Third quarter total revenues of $36.4 million increased by 8.2% year-over-year. Nine-month revenues of $95.2 million increa |
KNDI Price Returns
| 1-mo | -4.95% |
| 3-mo | -26.44% |
| 6-mo | -29.41% |
| 1-year | -46.22% |
| 3-year | -62.06% |
| 5-year | -64.31% |
| YTD | -31.43% |
| 2023 | 21.74% |
| 2022 | -28.35% |
| 2021 | -53.48% |
| 2020 | 45.88% |
| 2019 | 30.30% |
Continue Researching KNDI
Here are a few links from around the web to help you further your research on Kandi Technologies Group Inc's stock as an investment opportunity:Kandi Technologies Group Inc (KNDI) Stock Price | Nasdaq
Kandi Technologies Group Inc (KNDI) Stock Quote, History and News - Yahoo Finance
Kandi Technologies Group Inc (KNDI) Stock Price and Basic Information | MarketWatch
Loading social stream, please wait...