Kiniksa Pharmaceuticals, Ltd. - (KNSA): Price and Financial Metrics
GET POWR RATINGS... FREE!
KNSA POWR Grades
- Value is the dimension where KNSA ranks best; there it ranks ahead of 97.25% of US stocks.
- KNSA's strongest trending metric is Value; it's been moving up over the last 179 days.
- KNSA's current lowest rank is in the Stability metric (where it is better than 11.44% of US stocks).
KNSA Stock Summary
- Price to trailing twelve month operating cash flow for KNSA is currently 133.45, higher than 97.4% of US stocks with positive operating cash flow.
- For KNSA, its debt to operating expenses ratio is greater than that reported by only 8.27% of US equities we're observing.
- Revenue growth over the past 12 months for KINIKSA PHARMACEUTICALS LTD comes in at 471.24%, a number that bests 98.17% of the US stocks we're tracking.
- If you're looking for stocks that are quantitatively similar to KINIKSA PHARMACEUTICALS LTD, a group of peers worth examining would be AMWL, HYPR, DMRC, CLPT, and NCNO.
- KNSA's SEC filings can be seen here. And to visit KINIKSA PHARMACEUTICALS LTD's official web site, go to www.kiniksa.com.
KNSA Valuation Summary
- KNSA's price/sales ratio is 3.6; this is 89.47% higher than that of the median Healthcare stock.
- KNSA's price/sales ratio has moved NA NA over the prior 59 months.
Below are key valuation metrics over time for KNSA.
Stock | Date | P/S | P/B | P/E | EV/EBIT |
---|---|---|---|---|---|
KNSA | 2023-03-17 | 3.6 | 2.0 | 4.3 | 61.6 |
KNSA | 2023-03-16 | 3.6 | 2.0 | 4.4 | 61.9 |
KNSA | 2023-03-15 | 3.6 | 2.0 | 4.3 | 61.7 |
KNSA | 2023-03-14 | 3.6 | 2.0 | 4.3 | 60.8 |
KNSA | 2023-03-13 | 3.7 | 2.1 | 4.4 | 63.3 |
KNSA | 2023-03-10 | 3.8 | 2.1 | 4.6 | 65.3 |
KNSA's Quality Factors
The “Quality” component of the POWR Ratings focuses on 31 different factors of a companies fundamentals and operational strength. Here are some key insights as we drill into the specifics of these quality attributes.- KNSA has a Quality Grade of F, ranking ahead of 4.7% of graded US stocks.
- KNSA's asset turnover comes in at 0.023 -- ranking 364th of 682 Pharmaceutical Products stocks.
- 500 - Internal server error
The table below shows KNSA's key quality metrics over time.
Period | Asset Turnover | Gross Margin | ROIC |
---|---|---|---|
2021-06-30 | 0.023 | 0.68 | -1.083 |
2021-03-31 | 0.000 | NA | -0.935 |
2020-12-31 | 0.000 | NA | -0.872 |
2020-09-30 | 0.000 | NA | -0.783 |
2020-06-30 | 0.000 | NA | -0.802 |
2020-03-31 | 0.000 | NA | -0.755 |
KNSA Price Target
For more insight on analysts targets of KNSA, see our KNSA price target page. And for a list of of all stocks sorted by upside potential based on analyst target price, see our Top Price Target page.
Average Price Target | $32.00 | Average Broker Recommendation | 1.3 (Strong Buy) |
KNSA Stock Price Chart Interactive Chart >
KNSA Price/Volume Stats
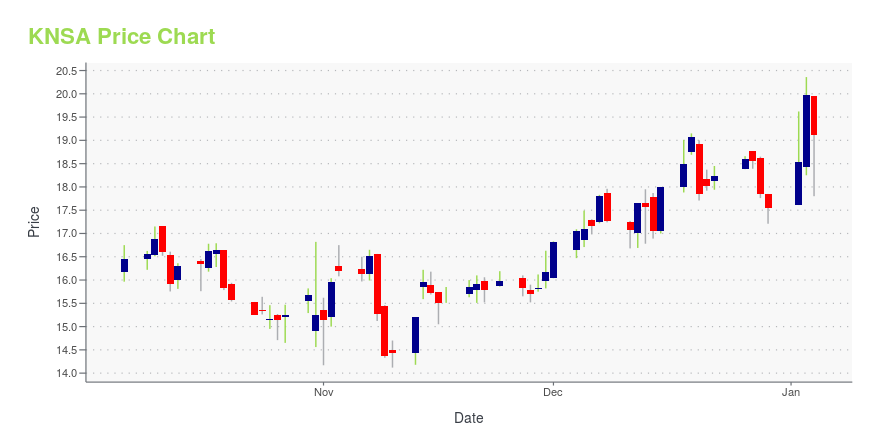
Current price | $11.41 | 52-week high | $17.19 |
Prev. close | $11.23 | 52-week low | $7.36 |
Day low | $10.76 | Volume | 232,500 |
Day high | $11.47 | Avg. volume | 389,082 |
50-day MA | $13.14 | Dividend yield | N/A |
200-day MA | $12.79 | Market Cap | 795.88M |
Kiniksa Pharmaceuticals, Ltd. - (KNSA) Company Bio
Kiniksa Pharmaceuticals, Ltd., a clinical-stage biopharmaceutical company, focuses on the discovering, acquiring, developing, and commercializing therapeutic medicines for patients suffering from debilitating diseases with significant unmet medical need worldwide. Its clinical-stage product candidates include Rilonacept, which is in Phase II clinical trials for the treatment of recurrent pericarditis, a debilitating inflammatory cardiovascular disease; Mavrilimumab, a monoclonal antibody for the treatment of giant cell arteritis; and KPL-716, a monoclonal antibody, which is in Phase 1a/1b clinical trial for the treatment of prurigo nodularis and atopic dermatitis. Kiniksa Pharmaceuticals, Ltd. was founded in 2015 and is based in Hamilton, Bermuda
Latest KNSA News From Around the Web
Below are the latest news stories about KINIKSA PHARMACEUTICALS LTD that investors may wish to consider to help them evaluate KNSA as an investment opportunity.
The Top 7 Growth Stocks in BiotechThe biotech sector always houses a great selection of growth stocks that can grow rapidly and reward investors over the long-term. |
Kiniksa Pharmaceuticals, Ltd. (KNSA) Beats Q4 Earnings and Revenue EstimatesKiniksa Pharmaceuticals, Ltd. (KNSA) delivered earnings and revenue surprises of 125% and 31.18%, respectively, for the quarter ended December 2022. Do the numbers hold clues to what lies ahead for the stock? |
Kiniksa Pharmaceuticals Reports Fourth Quarter and Full-Year 2022 Financial Results and Recent Portfolio Execution– ARCALYST® (rilonacept) Q4 2022 and full-year 2022 net product revenue of $39.9 million and $122.5 million, respectively – – ARCALYST full-year 2023 net product revenue expected to be $190 - $205 million, representing >60% year-over-year growth at the midpoint – – ARCALYST average total duration of therapy as of the end of Q4 2022 was ~18 months after accounting for patient restarts – – Cash reserves expected to fund operations into at least 2025 – HAMILTON, Bermuda, Feb. 28, 2023 (GLOBE NEWSWI |
Kiniksa Pharmaceuticals to Report Fourth Quarter and Full-Year 2022 Financial Results on February 28, 2023HAMILTON, Bermuda, Feb. 27, 2023 (GLOBE NEWSWIRE) -- Kiniksa Pharmaceuticals, Ltd. (Nasdaq: KNSA) announced today that it will host a conference call and live webcast on Tuesday, February 28, 2023, at 8:30 a.m. Eastern Time to report its fourth quarter and full-year 2022 financial results and recent portfolio execution. A live webcast will be accessible through the Investors & Media section of the company’s website at www.kiniksa.com. Individuals interested in participating in the call via telep |
Further weakness as Kiniksa Pharmaceuticals (NASDAQ:KNSA) drops 9.0% this week, taking three-year losses to 32%For many investors, the main point of stock picking is to generate higher returns than the overall market. But its... |
KNSA Price Returns
1-mo | -14.85% |
3-mo | -26.20% |
6-mo | 4.39% |
1-year | 14.67% |
3-year | -15.92% |
5-year | N/A |
YTD | -23.83% |
2022 | 27.27% |
2021 | -33.39% |
2020 | 59.76% |
2019 | -60.63% |
2018 | N/A |
Loading social stream, please wait...