
KURA SUSHI USA, INC. (KRUS): Price and Financial Metrics
KRUS Price/Volume Stats
| Current price | $54.61 | 52-week high | $122.81 |
| Prev. close | $52.83 | 52-week low | $49.01 |
| Day low | $53.56 | Volume | 181,496 |
| Day high | $55.20 | Avg. volume | 158,989 |
| 50-day MA | $78.44 | Dividend yield | N/A |
| 200-day MA | $85.01 | Market Cap | 613.32M |
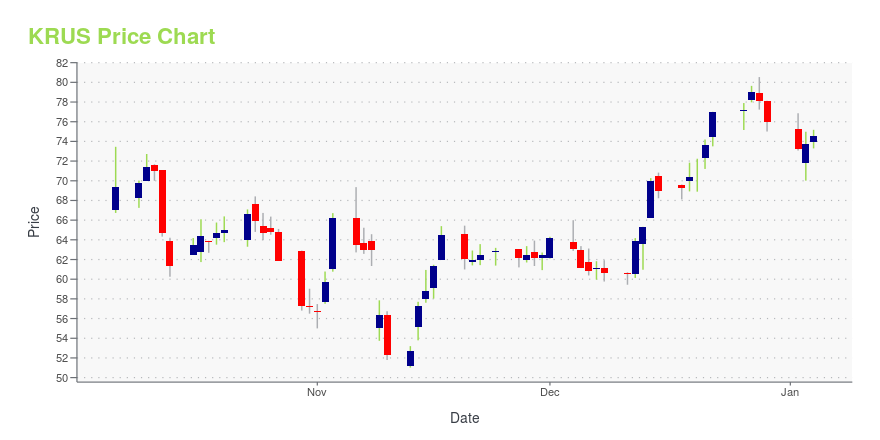
KRUS Stock Price Chart Interactive Chart >
KURA SUSHI USA, INC. (KRUS) Company Bio
Kura Sushi USA, Inc. engages in the operation of Japanese restaurant concept. It provides authentic Japanese cuisine and sushi service model. The company was founded by Hajime Uba in 2008 and is headquartered in Irvine, CA.
Latest KRUS News From Around the Web
Below are the latest news stories about KURA SUSHI USA INC that investors may wish to consider to help them evaluate KRUS as an investment opportunity.
Will Kura Sushi (KRUS) Report Negative Earnings Next Week? What You Should KnowKura Sushi (KRUS) doesn't possess the right combination of the two key ingredients for a likely earnings beat in its upcoming report. Get prepared with the key expectations. |
The Returns On Capital At Kura Sushi USA (NASDAQ:KRUS) Don't Inspire ConfidenceIf you're not sure where to start when looking for the next multi-bagger, there are a few key trends you should keep an... |
Why Kura Sushi (KRUS) Outpaced the Stock Market TodayKura Sushi (KRUS) closed the most recent trading day at $70.42, moving +1.63% from the previous trading session. |
Here's Why Kura Sushi (KRUS) Gained But Lagged the Market TodayKura Sushi (KRUS) concluded the recent trading session at $69.29, signifying a +0.43% move from its prior day's close. |
Kura Sushi USA to Announce Fiscal First Quarter 2024 Financial Results on January 4, 2024IRVINE, Calif., Dec. 14, 2023 (GLOBE NEWSWIRE) -- Kura Sushi USA, Inc. (“Kura Sushi” or the “Company”), (NASDAQ: KRUS), a technology-enabled Japanese restaurant concept, today announced that it will host a conference call to discuss fiscal first quarter 2024 financial results on Thursday, January 4, 2024 at 5:00 p.m. ET. A press release with fiscal first quarter 2024 financial results will be issued that same day after the market closes. Hosting the conference call and webcast will be Hajime “Ji |
KRUS Price Returns
| 1-mo | -34.85% |
| 3-mo | -52.08% |
| 6-mo | -40.17% |
| 1-year | -42.30% |
| 3-year | 2.32% |
| 5-year | N/A |
| YTD | -28.14% |
| 2023 | 59.40% |
| 2022 | -41.02% |
| 2021 | 314.56% |
| 2020 | -23.38% |
| 2019 | N/A |
Loading social stream, please wait...