
KVH Industries, Inc. (KVHI): Price and Financial Metrics
KVHI Price/Volume Stats
| Current price | $4.73 | 52-week high | $8.80 |
| Prev. close | $4.78 | 52-week low | $4.28 |
| Day low | $4.66 | Volume | 45,700 |
| Day high | $4.85 | Avg. volume | 101,345 |
| 50-day MA | $4.80 | Dividend yield | N/A |
| 200-day MA | $4.89 | Market Cap | 93.26M |
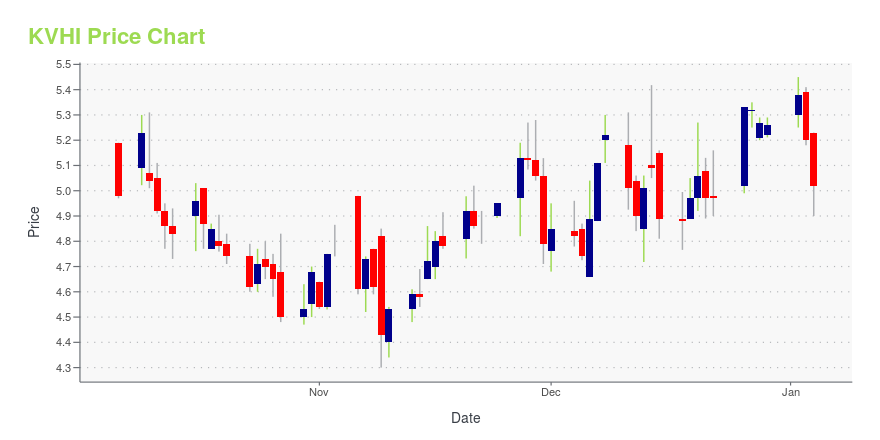
KVHI Stock Price Chart Interactive Chart >
KVH Industries, Inc. (KVHI) Company Bio
KVH Industries, Inc. designs, develops, manufactures, and markets mobile communication products and services for the marine and land mobile markets in the Americas, Europe, and Asia. The company was founded in 1978 and is based in Middletown, Rhode Island.
Latest KVHI News From Around the Web
Below are the latest news stories about KVH INDUSTRIES INC that investors may wish to consider to help them evaluate KVHI as an investment opportunity.
Fleets Facing Need to Improve Crew Morale and Wellbeing Turn to KVH for Content ServicesKVH Link’s news from home, movies and TV programming, social activities, and sports offer fleet and crewing managers an easy means of supporting crew welfareMIDDLETOWN, R.I., Nov. 20, 2023 (GLOBE NEWSWIRE) -- Recognizing the need to keep crew connected to home, family, and popular culture, innovative fleets such as TMS Gas Cardiff of the UK, Nereus Shipping SA in Greece, Tomini Transports LLC in Dubai, and GFS Fleet Management in Dubai have turned to KVH Industries, Inc. (Nasdaq: KVHI) for conte |
KVH Crew Wellbeing Solutions Honored with 2023 CAREER4SEA Europort AwardLeading maritime industry organization SAFETY4SEA recognizes KVH for providing connectivity services that enhance crew welfareMIDDLETOWN, R.I., Nov. 15, 2023 (GLOBE NEWSWIRE) -- On November 10, 2023, the SAFETY4SEA organization and Europort honored KVH Industries, Inc. (Nasdaq: KVHI) with its 2023 CAREER4SEA Europort Award for Crew Welfare. The award, presented during Europort 2023, recognizes KVH’s longstanding commitment to improving crew wellbeing through connectivity solutions and crew conte |
KVH Industries Inc (KVHI) Faces Challenges in Q3 2023 Despite Strategic PartnershipsImpairment Charges Impact Earnings Amidst Revenue Decline |
KVH Industries Reports Third Quarter 2023 ResultsMIDDLETOWN, R.I., Nov. 09, 2023 (GLOBE NEWSWIRE) -- KVH Industries, Inc. (Nasdaq: KVHI), reported financial results for the quarter ended September 30, 2023 today. The company will hold a conference call to discuss these results at 9:00 a.m. ET today, which can be accessed at investors.kvh.com. Following the call, a replay of the webcast will be available through the company’s website. Third Quarter 2023 Highlights Total revenues from continuing operations in the third quarter of 2023 were $33.5 |
KVH Industries to Host Third Quarter Conference Call on November 9, 2023MIDDLETOWN, R.I., Nov. 07, 2023 (GLOBE NEWSWIRE) -- KVH Industries, Inc. (Nasdaq: KVHI), will announce its financial results for the third quarter that ended September 30, 2023, on Thursday, November 9, 2023. In conjunction with the release, the company will conduct its investor conference call at 9:00 a.m. ET, hosted by Mr. Brent Bruun, CEO and Mr. Roger Kuebel, CFO. A live broadcast of the call will be available online at investors.kvh.com. In addition, an audio replay of the conference call w |
KVHI Price Returns
| 1-mo | -3.07% |
| 3-mo | -1.05% |
| 6-mo | -10.42% |
| 1-year | -44.68% |
| 3-year | -60.15% |
| 5-year | -53.72% |
| YTD | -10.08% |
| 2023 | -48.53% |
| 2022 | 11.21% |
| 2021 | -19.03% |
| 2020 | 1.98% |
| 2019 | 8.16% |
Continue Researching KVHI
Want to see what other sources are saying about Kvh Industries Inc's financials and stock price? Try the links below:Kvh Industries Inc (KVHI) Stock Price | Nasdaq
Kvh Industries Inc (KVHI) Stock Quote, History and News - Yahoo Finance
Kvh Industries Inc (KVHI) Stock Price and Basic Information | MarketWatch
Loading social stream, please wait...