Lazydays Holdings, Inc. (LAZY): Price and Financial Metrics
LAZY Price/Volume Stats
Current price | $6.40 | 52-week high | $14.36 |
Prev. close | $6.01 | 52-week low | $5.11 |
Day low | $5.76 | Volume | 116,300 |
Day high | $6.45 | Avg. volume | 108,530 |
50-day MA | $6.85 | Dividend yield | N/A |
200-day MA | $10.47 | Market Cap | 89.78M |
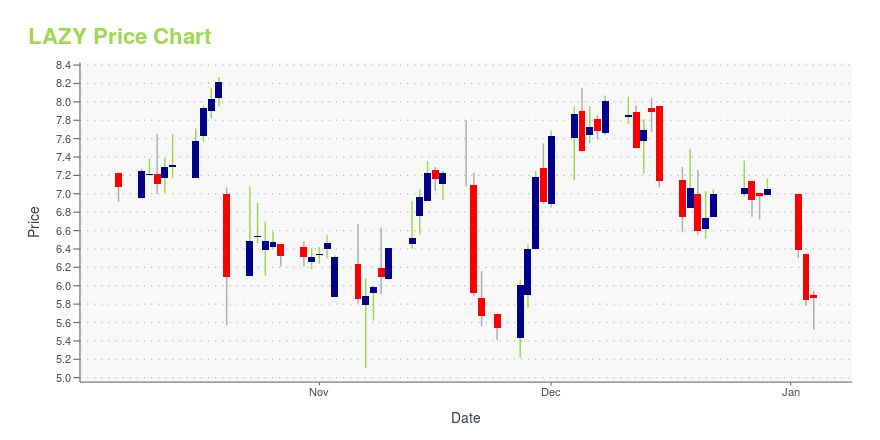
LAZY Stock Price Chart Interactive Chart >
LAZY POWR Grades
- LAZY scores best on the Value dimension, with a Value rank ahead of 57.63% of US stocks.
- The strongest trend for LAZY is in Growth, which has been heading up over the past 177 days.
- LAZY's current lowest rank is in the Quality metric (where it is better than 2.14% of US stocks).
LAZY Stock Summary
- LAZYDAYS HOLDINGS INC's capital turnover -- a measure of revenue relative to shareholder's equity -- is better than 88.44% of US listed stocks.
- With a price/sales ratio of 0.08, LAZYDAYS HOLDINGS INC has a higher such ratio than just 2.27% of stocks in our set.
- LAZYDAYS HOLDINGS INC's shareholder yield -- a measure of how much capital is returned to stockholders via dividends and buybacks -- is -138.13%, greater than the shareholder yield of merely 4.44% of stocks in our set.
- If you're looking for stocks that are quantitatively similar to LAZYDAYS HOLDINGS INC, a group of peers worth examining would be LE, VHI, ONEW, BXC, and OMI.
- LAZY's SEC filings can be seen here. And to visit LAZYDAYS HOLDINGS INC's official web site, go to www.lazydays.com.
LAZY Valuation Summary
- In comparison to the median Consumer Cyclical stock, LAZY's price/earnings ratio is 26.06% higher, now standing at 17.9.
- LAZY's EV/EBIT ratio has moved up 3 over the prior 67 months.
Below are key valuation metrics over time for LAZY.
Stock | Date | P/S | P/B | P/E | EV/EBIT |
---|---|---|---|---|---|
LAZY | 2023-10-20 | 0.1 | 0.3 | 17.9 | 13.6 |
LAZY | 2023-10-19 | 0.1 | 0.4 | 24.1 | 14.3 |
LAZY | 2023-10-18 | 0.1 | 0.4 | 23.5 | 14.3 |
LAZY | 2023-10-17 | 0.1 | 0.4 | 23.3 | 14.2 |
LAZY | 2023-10-16 | 0.1 | 0.4 | 22.2 | 14.1 |
LAZY | 2023-10-13 | 0.1 | 0.4 | 21.4 | 14.0 |
LAZY Growth Metrics
- Its 2 year net income to common stockholders growth rate is now at 2241.75%.
- Its 5 year net cashflow from operations growth rate is now at 8.68%.
- Its 5 year cash and equivalents growth rate is now at 225.53%.

The table below shows LAZY's growth in key financial areas (numbers in millions of US dollars).
Date | Revenue | Operating Cash Flow | Net Income to Common Stock |
---|---|---|---|
2022-09-30 | 1,406.007 | -90.969 | 79.888 |
2022-06-30 | 1,390.977 | -112.641 | 103.192 |
2022-03-31 | 1,340.216 | -39.485 | 96.657 |
2021-12-31 | 1,235.048 | 2.771 | 77.22 |
2021-09-30 | 1,109.084 | 55.398 | 52.293 |
2021-06-30 | 1,006.079 | 111.124 | 32.388 |
LAZY's Quality Factors
The “Quality” component of the POWR Ratings focuses on 31 different factors of a companies fundamentals and operational strength. Here are some key insights as we drill into the specifics of these quality attributes.- LAZY has a Quality Grade of B, ranking ahead of 77.69% of graded US stocks.
- LAZY's asset turnover comes in at 2.248 -- ranking 32nd of 165 Retail stocks.
- 500 - Internal server error
The table below shows LAZY's key quality metrics over time.
Period | Asset Turnover | Gross Margin | ROIC |
---|---|---|---|
2021-06-30 | 2.248 | 0.242 | 0.224 |
2021-03-31 | 2.081 | 0.225 | 0.141 |
2020-12-31 | 1.940 | 0.219 | 0.108 |
2020-12-31 | 1.940 | 0.219 | 0.155 |
2020-09-30 | 1.859 | 0.214 | 0.117 |
2020-06-30 | 1.744 | 0.205 | 0.060 |
LAZY Price Target
For more insight on analysts targets of LAZY, see our LAZY price target page. And for a list of of all stocks sorted by upside potential based on analyst target price, see our Top Price Target page.
Average Price Target | $28.50 | Average Broker Recommendation | 1.75 (Moderate Buy) |
Lazydays Holdings, Inc. (LAZY) Company Bio
Lazydays Holdings, Inc. operates as a holding company. The Company, through its subsidiaries, retails recreational vehicles and related accessories, as well as offers repairs and maintenance services. Lazydays Holdings serves customers in the United States.
Latest LAZY News From Around the Web
Below are the latest news stories about LAZYDAYS HOLDINGS INC that investors may wish to consider to help them evaluate LAZY as an investment opportunity.
Lazydays (LAZY) Acquires Orangewood RV Center in ArizonaLazydays (LAZY) expands to its 24th location by acquiring Orangewood RV Center, an dealership in Surprise, AZ. |
LAZYDAYS ANNOUNCES ACQUISITION OF ORANGEWOOD RV CENTER IN SURPRISE, ARIZONALazydays (NasdaqCM: LAZY) is pleased to announce the acquisition of Orangewood RV Center, an RV dealership located in Surprise, Arizona. The store has been renamed "Lazydays RV of Phoenix at Arrowhead" and marks the 24th location in its growing nationwide network, strengthening its presence in the Western region. Lazydays expects the new store to generate approximately $40 million in annualized revenue. In 2023, Lazydays has completed five acquisitions and opened three greenfield locations which |
Bowlus and Lazydays Announce Exclusive National PartnershipBowlus, the world leader in performance luxury recreation vehicles, announces its exclusive national partnership with Lazydays (NasdaqCM: LAZY). |
LAZYDAYS ANNOUNCES CANCELLATION OF RIGHTS OFFERING TO STOCKHOLDERSLazydays Holdings, Inc. (Nasdaq: LAZY) (the "Company" or "Lazydays") announced today that it has cancelled its previously announced rights offering of shares of the Company's common stock, par value $0.0001 per share (the "Common Stock") that had been made to holders (the "Holders") of the Company's Common Stock, pre-funded warrants and series A convertible preferred stock. |
LAZYDAYS ANNOUNCES ACQUISITION OF STORE IN ST. GEORGE, UTAHLazydays (NasdaqCM: LAZY) is thrilled to announce the acquisition of RVzz, an RV dealership located in St. George, Utah. The store has been renamed "Lazydays RV of St. George" and marks the 23rd location in its growing nationwide network, strengthening its presence in the Southwest region. Lazydays anticipates $35 million in annualized revenue from the new store. |
LAZY Price Returns
1-mo | 1.43% |
3-mo | -45.67% |
6-mo | -43.86% |
1-year | -53.18% |
3-year | -60.07% |
5-year | 20.98% |
YTD | -46.40% |
2022 | -44.57% |
2021 | 32.55% |
2020 | 296.34% |
2019 | -24.07% |
2018 | N/A |
Continue Researching LAZY
Want to do more research on Lazydays Holdings Inc's stock and its price? Try the links below:Lazydays Holdings Inc (LAZY) Stock Price | Nasdaq
Lazydays Holdings Inc (LAZY) Stock Quote, History and News - Yahoo Finance
Lazydays Holdings Inc (LAZY) Stock Price and Basic Information | MarketWatch
Loading social stream, please wait...