
L Brands, Inc. (LB): Price and Financial Metrics
LB Price/Volume Stats
| Current price | $30.13 | 52-week high | $32.91 |
| Prev. close | $29.55 | 52-week low | $18.75 |
| Day low | $29.46 | Volume | 225,472 |
| Day high | $30.54 | Avg. volume | 469,421 |
| 50-day MA | $0.00 | Dividend yield | N/A |
| 200-day MA | $0.00 | Market Cap | 2.20B |
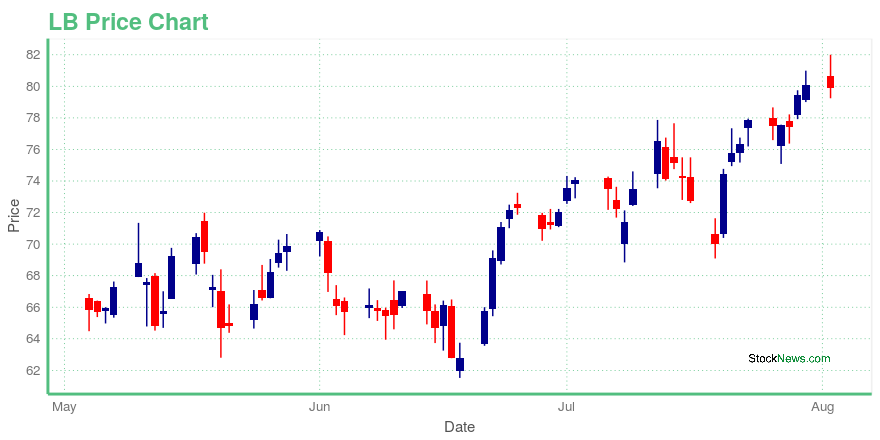
LB Stock Price Chart Interactive Chart >
L Brands, Inc. (LB) Company Bio
L Brands Inc. operates as a specialty retailer of womens intimate and other apparel, beauty and personal care products, and accessories. The company operates in three segments: Victorias Secret, Bath & Body Works, and Victoria's Secret and Bath & Body Works International. The company was founded in 1963 and is based in Columbus, Ohio.
Latest LB News From Around the Web
Below are the latest news stories about L Brands Inc that investors may wish to consider to help them evaluate LB as an investment opportunity.
Victoria’s Secret Renamed as It Prepares for Life on the Public MarketShares of Victoria's Secret & Co. began trading provisionally Monday and were priced around $45 each. |
Companies Owned by L Brands, Including Victoria's Secret (Lb)L Brands Inc. (NYSE: LB) operates a specialty retail business focused on women's intimate and other apparel, personal care, and beauty categories. In 1982, L Brands, then known as The Limited Inc., was first listed on the New York Stock Exchange. L Brands has grown rapidly, expanding its brand through organic growth and acquisitions. |
These 2 Major Brands Are Threatening Malls' SurvivalOver the past year, a number of retailers have talked about abandoning malls and opening stand-alone stores in shopping centers instead. First, establishing a shopping center presence gives retailers a chance to attract customers without the same competition that would normally be found in a mall setting. Off-mall stores in shopping centers help solve that issue to some degree. |
Victoria''s Secret parent will spend $90 million on anti-sexual harassment and diversity plans, after shareholders said former leaders created a ''culture of misogyny, bullying and harassment''Shareholders sued former execs Les Wexner and Ed Razek. One suit alleged they "allowed and enabled L Brands to develop a hostile abusive environment." |
L Brands Announces Settlement of Stockholder Derivative ClaimsCOLUMBUS, Ohio, July 30, 2021 (GLOBE NEWSWIRE) -- L Brands, Inc. (NYSE: LB) announced today the global settlement of all stockholder derivative claims alleging workplace misconduct at the company, including claims made in derivative stockholder litigations pending in Ohio and Delaware and in stockholder demands sent to the Board of Directors (the Board) since February 2020. In the settlement, L Brands has agreed to a suite of corporate governance and management measures, including the maintenance of a Diversity, Equity and Inclusion (DEI) Council, the strengthening of policies and procedures for reporting and investigating sexual harassment complaints and the hiring of a DEI consultant. These measures, which continue the governance and management reforms the Board has been implementing ... |
LB Price Returns
| 1-mo | N/A |
| 3-mo | N/A |
| 6-mo | N/A |
| 1-year | N/A |
| 3-year | -61.14% |
| 5-year | 19.79% |
| YTD | N/A |
| 2023 | N/A |
| 2022 | N/A |
| 2021 | 0.00% |
| 2020 | 107.78% |
| 2019 | -25.18% |
Continue Researching LB
Want to see what other sources are saying about L Brands Inc's financials and stock price? Try the links below:L Brands Inc (LB) Stock Price | Nasdaq
L Brands Inc (LB) Stock Quote, History and News - Yahoo Finance
L Brands Inc (LB) Stock Price and Basic Information | MarketWatch
Loading social stream, please wait...