
Luther Burbank Corporation (LBC): Price and Financial Metrics
LBC Price/Volume Stats
| Current price | $9.15 | 52-week high | $11.77 |
| Prev. close | $9.10 | 52-week low | $7.73 |
| Day low | $9.06 | Volume | 325,900 |
| Day high | $9.34 | Avg. volume | 35,951 |
| 50-day MA | $9.85 | Dividend yield | N/A |
| 200-day MA | $9.26 | Market Cap | 466.81M |
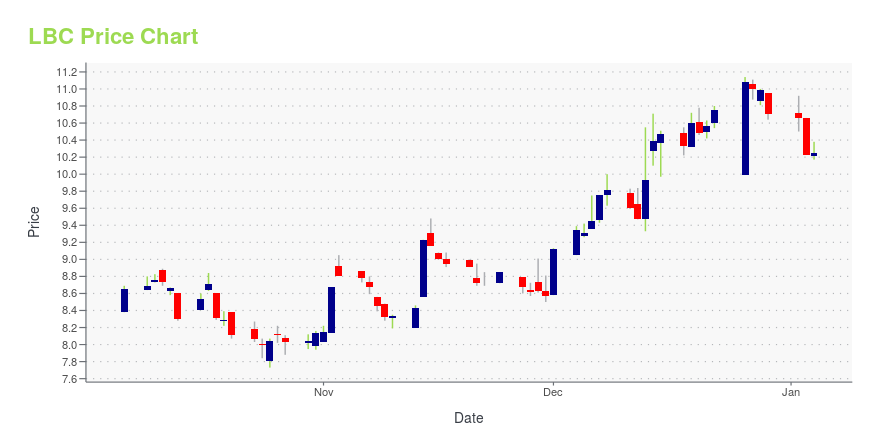
LBC Stock Price Chart Interactive Chart >
Luther Burbank Corporation (LBC) Company Bio
Luther Burbank Corporation operates as the bank holding company for Luther Burbank Savings that provides various banking products and services for individuals, entrepreneurs, professionals, and businesses in California, Washington, and Oregon. The company was founded in 1983 and is based in Santa Rosa, California.
Latest LBC News From Around the Web
Below are the latest news stories about LUTHER BURBANK CORP that investors may wish to consider to help them evaluate LBC as an investment opportunity.
WaFd, Luther Burbank extend merger deadline to FebruaryBoth banks say they're "fully committed" to the deal, but it's the second delay for the transaction, originally expected to close by June 2023. It also faces opposition from a coalition of 54 nonprofits. |
Investors in Luther Burbank (NASDAQ:LBC) have unfortunately lost 27% over the last yearPassive investing in an index fund is a good way to ensure your own returns roughly match the overall market. When you... |
Luther Burbank Corporation Reports Earnings for the Quarter and Nine Months Ended September 30, 2023Third Quarter 2023 Highlights Net income of $1.9 million and $22.3 million, or $0.04 and $0.44 per diluted share, for the quarter and nine months ended September 30, 2023, respectivelyNet interest margin of 0.97%Return on average assets and equity of 0.09% and 1.09%, respectivelyNoninterest expense to average assets of 0.73%Estimated uninsured deposits remained stable at $1.0 billion, or 17.6% of total depositsDependence on wholesale funds declined to 27.6% (1)Liquidity ratio of 13.8% (1)On-bala |
LIBERO CLOSES PRIVATE PLACEMENTLibero Copper & Gold Corporation (TSXV: LBC) (OTCQB: LBCMF) (DE: 29H) announces it has closed the first tranche of a non-brokered private placement (the "Offering") for the sale of 9,130,000 units (the "Units") at a price of C$0.05 per Unit for gross proceeds of C$456,500. Each Unit is comprised of one common share (each, a "Unit Share") and one common share purchase warrant (each, a "Warrant"). Each Warrant entitles the holder thereof to purchase one common share (each, a "Warrant Share") at a |
Luther Burbank Corporation Reports Earnings for the Quarter and Six Months Ended June 30, 2023Second Quarter 2023 Highlights Net income of $6.9 million, or $0.14 per diluted shareNet interest margin of 1.27%Return on average assets and equity of 0.33% and 3.94%, respectivelyNoninterest expense to average assets of 0.76%Deposits increased 3% to $5.8 billionEstimated uninsured deposits of $997.8 million, or 17.1% of total depositsOn-balance sheet liquidity plus borrowing capacity of more than 3 times uninsured depositsNonperforming assets to total assets of 0.06%Book value per share of $13 |
LBC Price Returns
| 1-mo | N/A |
| 3-mo | N/A |
| 6-mo | -9.58% |
| 1-year | -11.08% |
| 3-year | -22.19% |
| 5-year | -9.81% |
| YTD | -14.57% |
| 2023 | -3.60% |
| 2022 | -17.87% |
| 2021 | 47.37% |
| 2020 | -12.97% |
| 2019 | 30.69% |
Continue Researching LBC
Here are a few links from around the web to help you further your research on Luther Burbank Corp's stock as an investment opportunity:Luther Burbank Corp (LBC) Stock Price | Nasdaq
Luther Burbank Corp (LBC) Stock Quote, History and News - Yahoo Finance
Luther Burbank Corp (LBC) Stock Price and Basic Information | MarketWatch
Loading social stream, please wait...