Lannett Co Inc (LCI): Price and Financial Metrics
Lannett Co Inc (LCI)
Today's Latest Price: $6.56 USD
Updated Jan 21 1:24pm
Add LCI to WatchlistSign Up
POWR Components:
Trade Grade Buy & Hold Grade Peer Grade Industry Rank
Industry Rank:
Ranked of 239 in Medical - Pharmaceuticals
See all "A" rated Strong Buy stocks
LCI Stock Summary
- Price to trailing twelve month operating cash flow for LCI is currently 2.78, higher than merely 11.67% of US stocks with positive operating cash flow.
- LCI's price/sales ratio is 0.51; that's higher than the P/S ratio of only 12.64% of US stocks.
- Lannett Co Inc's shareholder yield -- a measure of how much capital is returned to stockholders via dividends and buybacks -- is 25.52%, greater than the shareholder yield of 92.05% of stocks in our set.
- If you're looking for stocks that are quantitatively similar to Lannett Co Inc, a group of peers worth examining would be SPR, ENVA, GOGO, FCEL, and HL.
- Visit LCI's SEC page to see the company's official filings. To visit the company's web site, go to www.lannett.com.
LCI Stock Price Chart Interactive Chart >
LCI Price/Volume Stats
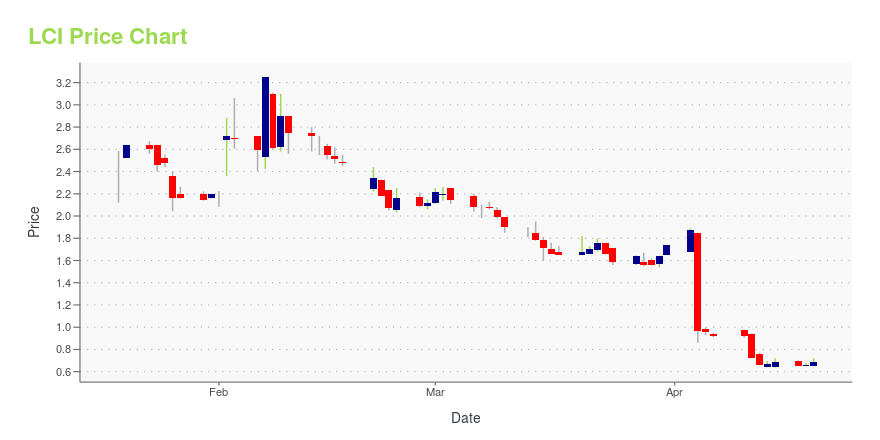
Current price | $6.56 | 52-week high | $10.05 |
Prev. close | $6.65 | 52-week low | $4.89 |
Day low | $6.48 | Volume | 121,969 |
Day high | $6.65 | Avg. volume | 273,244 |
50-day MA | $6.52 | Dividend yield | N/A |
200-day MA | $6.73 | Market Cap | 273.55M |
Lannett Co Inc (LCI) Company Bio
Lannett Company develops, manufactures, packages, markets and distributes generic pharmaceutical products for a wide range of medical indications. The company was founded in 1942 and is based in Philadelphia, Pennsylvania.
LCI Price Forecast Based on DCF Valuation
Current Price | DCF Fair Value Target: | Forecasted Gain: |
$6.56 | $5.16 | -22% |
Below please find a table outlining a discounted cash flow forecast for LCI, in which we model out valuation assuming a variety of terminal growth rates. To summarize, we found that Lannett Co Inc ranked in the 46th percentile in terms of potential gain offered. Our DCF analysis suggests the stock is overvalued by about 22%. As for the metrics that stood out in our discounted cash flow analysis of Lannett Co Inc, consider:
- The company's debt burden, as measured by earnings divided by interest payments, is 0.15 -- which is good for besting just 24.31% of its peer stocks (US stocks in the Healthcare sector with positive cash flow).
- The company's compound free cash flow growth rate over the past 5.5 years comes in at -0.02%; that's greater than merely 22.2% of US stocks we're applying DCF forecasting to.
- 28% of the company's capital comes from equity, which is greater than just 7.8% of stocks in our cash flow based forecasting set.
Terminal Growth Rate in Free Cash Flow | Return Relative to Current Share Price |
0% | -24% |
1% | -23% |
2% | -22% |
3% | -22% |
4% | -21% |
5% | -20% |
For other companies in the Healthcare that have a similar discounted cashflow valuation profile (and ensuing price forecasts) as LCI, try LMAT, INBP, IQV, PAHC, and BDX.
Loading social stream, please wait...