Lucid Group Inc. (LCID): Price and Financial Metrics
LCID Price/Volume Stats
Current price | $6.90 | 52-week high | $21.78 |
Prev. close | $6.59 | 52-week low | $6.09 |
Day low | $6.53 | Volume | 42,394,013 |
Day high | $6.91 | Avg. volume | 25,847,172 |
50-day MA | $7.50 | Dividend yield | N/A |
200-day MA | $10.22 | Market Cap | 12.66B |
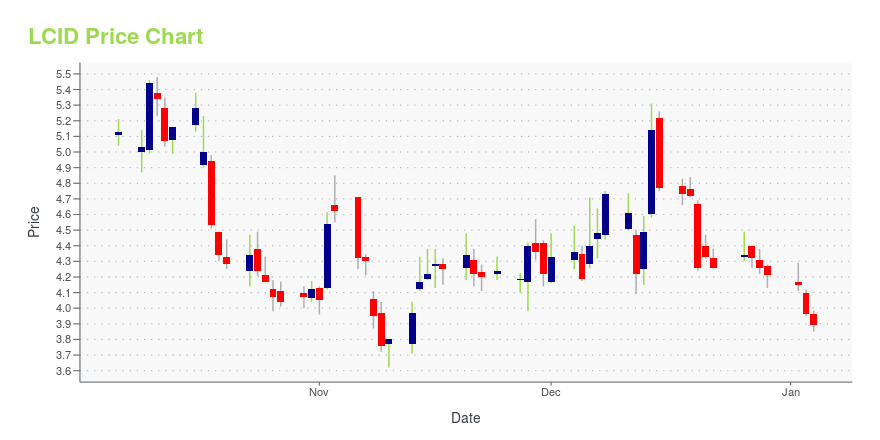
LCID Stock Price Chart Interactive Chart >
LCID POWR Grades
- LCID scores best on the Momentum dimension, with a Momentum rank ahead of 73.38% of US stocks.
- LCID's strongest trending metric is Growth; it's been moving down over the last 179 days.
- LCID's current lowest rank is in the Quality metric (where it is better than 0.38% of US stocks).
LCID Stock Summary
- LCID has a higher market value than 87.33% of US stocks; more precisely, its current market capitalization is $13,738,517,288.
- LCID's price/sales ratio is 19.63; that's higher than the P/S ratio of 94.22% of US stocks.
- As for revenue growth, note that LCID's revenue has grown 728.59% over the past 12 months; that beats the revenue growth of 98.77% of US companies in our set.
- If you're looking for stocks that are quantitatively similar to LUCID GROUP INC, a group of peers worth examining would be PACB, RIVN, HLTH, YMAB, and NWBO.
- To check out LUCID GROUP INC's SEC filings, go to the company's page on browse-edgar?action=getcompany&CIK=0001811210.
LCID Valuation Summary
- In comparison to the median Consumer Cyclical stock, LCID's EV/EBIT ratio is 152.71% lower, now standing at -7.3.
- Over the past 34 months, LCID's price/sales ratio has gone down 389.7.
Below are key valuation metrics over time for LCID.
Stock | Date | P/S | P/B | P/E | EV/EBIT |
---|---|---|---|---|---|
LCID | 2023-05-19 | 18.8 | 3.6 | -6.6 | -7.3 |
LCID | 2023-05-18 | 19.1 | 3.7 | -6.7 | -7.4 |
LCID | 2023-05-17 | 18.9 | 3.7 | -6.6 | -7.3 |
LCID | 2023-05-16 | 18.3 | 3.5 | -6.4 | -7.1 |
LCID | 2023-05-15 | 18.8 | 3.6 | -6.6 | -7.3 |
LCID | 2023-05-12 | 18.4 | 3.6 | -6.4 | -7.1 |
LCID's Quality Factors
The “Quality” component of the POWR Ratings focuses on 31 different factors of a companies fundamentals and operational strength. Here are some key insights as we drill into the specifics of these quality attributes.- LCID has a Quality Grade of C, ranking ahead of 28.4% of graded US stocks.
- LCID's asset turnover comes in at 0.002 -- ranking 60th of 68 Automobiles and Trucks stocks.
- 500 - Internal server error
The table below shows LCID's key quality metrics over time.
Period | Asset Turnover | Gross Margin | ROIC |
---|---|---|---|
2021-06-30 | 0.002 | 0.289 | -1.181 |
Lucid Group Inc. (LCID) Company Bio
Lucid Motors, Inc. is an American electric vehicle manufacturer headquartered in Newark, California. Lucid's other divisions include energy storage, and original equipment manufacturing. The company was founded in 2007.
Latest LCID News From Around the Web
Below are the latest news stories about LUCID GROUP INC that investors may wish to consider to help them evaluate LCID as an investment opportunity.
Buy Alphabet & Jefferies, avoid American Airlines & Lucid: StrategistAlphabet and Jefferies are two stocks to buy and American Airlines and Lucid Group shares are stocks to avoid, according to Christian Ledoux, Director of Investments at CAPTRUST. He tells Yahoo Finance Live's Seana Smith and Akiko Fujita why. |
7 Electric Vehicle Stocks to Sell for June 2023These worst performing EV stocks offer little upside ahead in a market that is likely to struggle amidst a rough macro-backdrop this year |
Steer Clear of Lucid Stock Even as Big Players Make Bold BetsLucid Group likes to tout its luxury-focused EV lineup, but LCID stock won't likely get off the ground if Lucid can't sell many vehicles. |
Don’t Be Surprised if Rivian Stock Drives Into Single DigitsUntil more suggests RIVN stock can avoid running out of range/keep rolling backwards downhill, consider it wise to keep staying away. |
Beware! LCID Stock Has Yet to Hit Rock Bottom.Major issues point to LCID stock soon re-entering an extended price slide. |
LCID Price Returns
1-mo | -10.74% |
3-mo | -17.27% |
6-mo | -20.51% |
1-year | -63.97% |
3-year | N/A |
5-year | N/A |
YTD | 1.02% |
2022 | -82.05% |
2021 | 280.12% |
2020 | N/A |
2019 | N/A |
2018 | N/A |
Loading social stream, please wait...