
Leslie's Inc. (LESL): Price and Financial Metrics
LESL Price/Volume Stats
| Current price | $2.99 | 52-week high | $8.21 |
| Prev. close | $2.86 | 52-week low | $2.42 |
| Day low | $2.85 | Volume | 2,768,500 |
| Day high | $3.07 | Avg. volume | 4,074,344 |
| 50-day MA | $4.36 | Dividend yield | N/A |
| 200-day MA | $5.61 | Market Cap | 552.38M |
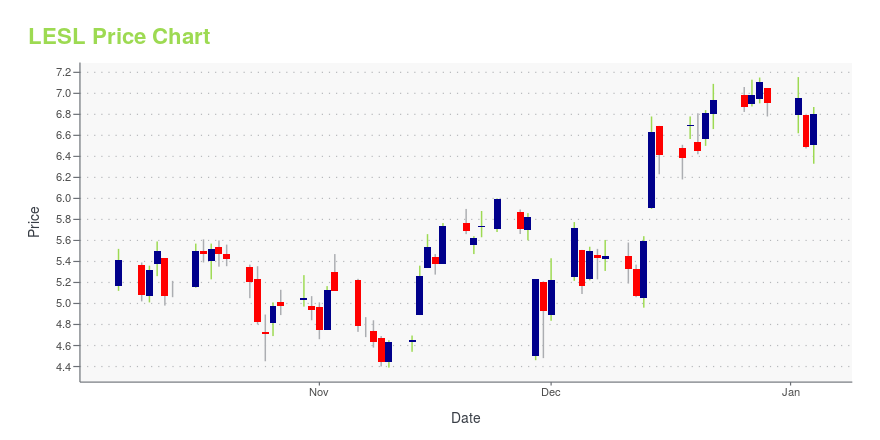
LESL Stock Price Chart Interactive Chart >
Leslie's Inc. (LESL) Company Bio
Leslie's, Inc. engages in the provision of direct-to-consumer pool and spa care services. It serves the residential, professional, and commercial customers. The firm also offers complimentary, commercial-grade, in-store water testing and analysis via its proprietary AccuBlue system, which increases consumer engagement, conversion, basket size, and loyalty, resulting in higher lifetime value. The company offers a range of products that consists of regularly purchased, non-discretionary pool and spa maintenance items such as chemicals, equipment, cleaning accessories and parts, as well as installation and repair services for pool and spa equipment. Leslie's was founded in 1963 and is headquartered in Phoenix, AZ.
Latest LESL News From Around the Web
Below are the latest news stories about LESLIE'S INC that investors may wish to consider to help them evaluate LESL as an investment opportunity.
A Look At The Intrinsic Value Of Leslie's, Inc. (NASDAQ:LESL)Key Insights Using the 2 Stage Free Cash Flow to Equity, Leslie's fair value estimate is US$7.43 Current share price of... |
Leslie’s Announces Changes to its Board of DirectorsSteven L. Ortega Will Retire at Leslie’s 2024 Annual Meeting of Shareholders John Strain Assumes Role of Lead Independent Director and Named Chairman-Elect James Ray, Jr., Lead Independent Director, Steps Down from Board PHOENIX, Dec. 19, 2023 (GLOBE NEWSWIRE) -- Leslie’s, Inc. ("Leslie's" or the “Company”; NASDAQ: LESL) announced today that Steven L. Ortega, Chairman of the Board of Directors (the “Board”), has decided not to seek reelection at Leslie’s 2024 Annual Meeting of Shareholders in Ma |
Should You Consider Selling Leslie’s (LESL)?TimesSquare Capital Management, an equity investment management company, released its “U.S. Small Cap Growth Strategy” third-quarter investor letter. A copy of the same can be downloaded here. In the quarter the fund returned -3.67% (net), compared to -7.32% return for the Russell 2000 Growth Index. Year-to-date the fund returned 11.56% (net) compared to 9.59% return for […] |
Leslie’s, Inc. (NASDAQ:LESL) Q4 2023 Earnings Call TranscriptLeslie’s, Inc. (NASDAQ:LESL) Q4 2023 Earnings Call Transcript November 28, 2023 Leslie’s, Inc. misses on earnings expectations. Reported EPS is $0.14 EPS, expectations were $0.16. Operator: Good afternoon and welcome to the Fourth Quarter of Fiscal 2023 Conference Call for Leslie’s, Inc. At this time, all participants are in a listen-only mode. Following the prepared […] |
Why Are Stocks Up Today?Stocks are up today as investors react to the latest comments from members of the Federal Reserve and an increased Consumer Confidence Index. |
LESL Price Returns
| 1-mo | -26.35% |
| 3-mo | -25.06% |
| 6-mo | -56.35% |
| 1-year | -52.39% |
| 3-year | -87.91% |
| 5-year | N/A |
| YTD | -56.73% |
| 2023 | -43.41% |
| 2022 | -48.39% |
| 2021 | -14.74% |
| 2020 | N/A |
| 2019 | N/A |
Loading social stream, please wait...