
Lument Finance Trust Inc. (LFT): Price and Financial Metrics
LFT Price/Volume Stats
| Current price | $2.37 | 52-week high | $2.56 |
| Prev. close | $2.30 | 52-week low | $1.53 |
| Day low | $2.29 | Volume | 42,300 |
| Day high | $2.37 | Avg. volume | 69,353 |
| 50-day MA | $2.34 | Dividend yield | 12.17% |
| 200-day MA | $2.21 | Market Cap | 123.83M |
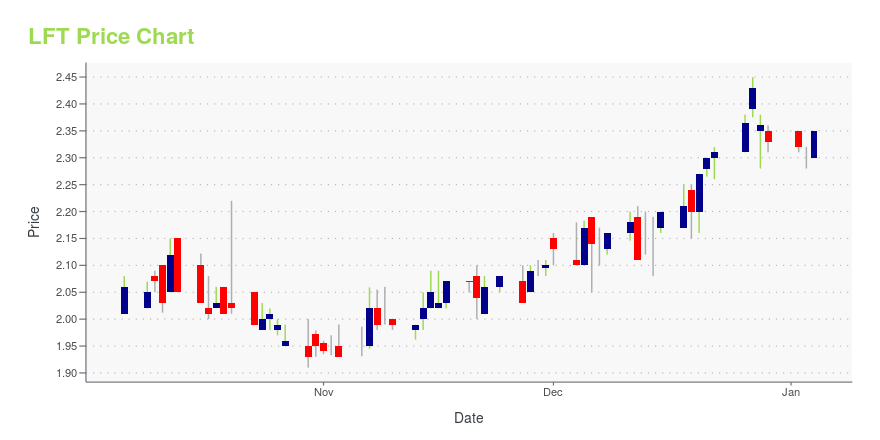
LFT Stock Price Chart Interactive Chart >
Lument Finance Trust Inc. (LFT) Company Bio
Lument Finance Trust, Inc. operates as a real estate investment finance company, which engages in investing, financing, and managing a portfolio of mortgage-backed securities, residential mortgage loans, and other mortgage related investments. Its objective is to attract long-term risk-adjusted returns to its stockholders. The company was founded on March 28, 2012 and is headquartered in New York, NY.
Latest LFT News From Around the Web
Below are the latest news stories about LUMENT FINANCE TRUST INC that investors may wish to consider to help them evaluate LFT as an investment opportunity.
Lument Finance Trust, Inc. Declares Quarterly Cash Dividends for its Common and Preferred StockLument Finance Trust, Inc. (NYSE: LFT) ("LFT" or the "Company") announced the declaration of a cash dividend of $0.07 per share of common stock with respect to the fourth quarter of 2023. The dividend is payable on January 16, 2024, to common stockholders of record as of the close of business on December 29, 2023. |
Lument Finance Trust Reports Third Quarter ResultsLument Finance Trust, Inc. (NYSE: LFT) ("we," "LFT" or "the Company") today reported its third quarter 2023 results. Distributable earnings for the quarter were $6.0 million, or $0.11 per share of common stock. GAAP net income attributable to common shareholders for the quarter was $5.2 million, or $0.10 per share of common stock. The Company has also issued a detailed presentation of its results, which can be viewed at www.lumentfinancetrust.com. |
Lument Finance Trust Announces Quarter-End Earnings Release and Investor Call DatesLument Finance Trust, Inc. (NYSE: LFT) ("we," "LFT" or "the Company") announced today that it expects to file its Quarterly Report on Form 10-Q for the quarter ended September 30, 2023, with the Securities and Exchange Commission on Monday, November 13, 2023, after market close. The Company invites investors and other interested parties to listen to its live conference call via telephone or webcast on Tuesday, November 14, 2023, at 8:30 a.m. EST. |
Lument Finance Trust, Inc. Announces Quarterly Common Stock Dividend IncreaseLument Finance Trust, Inc. (NYSE: LFT) ("LFT" or the "Company") announced the declaration of a cash dividend of $0.07 per share of common stock with respect to the third quarter of 2023, which represents a 17% increase over the second quarter of 2023 dividend of $0.06 per share. The dividend is payable on October 16, 2023 to common stockholders of record as of the close of business on September 29, 2023. |
Lument Finance Trust Reports Second Quarter ResultsLument Finance Trust, Inc. (NYSE: LFT) ("we," "LFT" or "the Company") today reported its second quarter 2023 results. Distributable earnings for the quarter were $1.9 million, or $0.04 per share of common stock. GAAP net income attributable to common shareholders for the quarter was $1.4 million, or $0.03 per share of common stock. The Company has also issued a detailed presentation of its results, which can be viewed at www.lumentfinancetrust.com. |
LFT Price Returns
| 1-mo | N/A |
| 3-mo | -2.13% |
| 6-mo | 28.68% |
| 1-year | 45.37% |
| 3-year | -13.33% |
| 5-year | N/A |
| YTD | 4.59% |
| 2023 | 38.64% |
| 2022 | -45.07% |
| 2021 | 28.63% |
| 2020 | 15.69% |
| 2019 | N/A |
LFT Dividends
| Ex-Dividend Date | Type | Payout Amount | Change | ||||||
|---|---|---|---|---|---|---|---|---|---|
| Loading, please wait... | |||||||||
Loading social stream, please wait...