
LGL Group, Inc. (The) (LGL): Price and Financial Metrics
LGL Price/Volume Stats
| Current price | $5.56 | 52-week high | $6.76 |
| Prev. close | $5.69 | 52-week low | $4.20 |
| Day low | $5.56 | Volume | 400 |
| Day high | $5.70 | Avg. volume | 5,759 |
| 50-day MA | $5.29 | Dividend yield | N/A |
| 200-day MA | $5.49 | Market Cap | 29.76M |
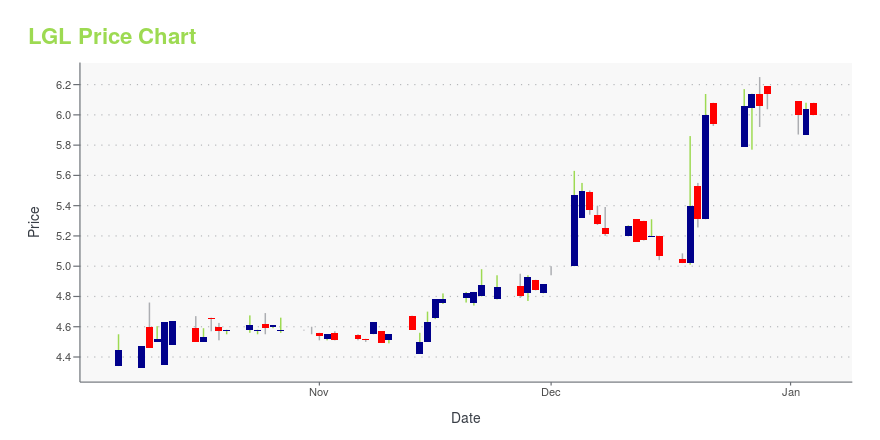
LGL Stock Price Chart Interactive Chart >
LGL Group, Inc. (The) (LGL) Company Bio
The LGL Group, Inc., together with its subsidiaries, engages in the design, manufacture, and marketing of frequency and spectrum control products in the United States and internationally. The company operates in two segments, Electronic Components and Electronic Instruments. The Electronic Components segment offers XTAL, clock oscillators, VCXO, TCXO OCXO, and DOCXO devices; and radio frequency, microwave and millimeter wave filters, diplexers, and solid-state power amplifiers. It also provides filter devices, which includes crystal, ceramic, LC, tubular, combline, cavity, interdigital, and metal insert waveguide, as well as digital, analog and mechanical tunable filters, switched filter arrays, and RF subsystems. This segment's products are used in infrastructure equipment for the telecommunications and network equipment industries; and electronic systems for applications in defense, aerospace, earth-orbiting satellites, down-hole drilling, medical devices, instrumentation, industrial devices, and global positioning systems. The Electronic Instruments segment designs and manufactures frequency and time reference standards, distribution amplifiers, redundancy auto switches, and NTP servers for timing and synchronization in various applications. Its products are used in computer networking, satellite earth stations, electric utilities, broadcasting, and telecommunication systems. The company was formerly known as Lynch Corporation and changed its name to The LGL Group, Inc. The LGL Group, Inc. was founded in 1917 and is based in Orlando, Florida.
Latest LGL News From Around the Web
Below are the latest news stories about LGL GROUP INC that investors may wish to consider to help them evaluate LGL as an investment opportunity.
The LGL Group to Present at Sidoti Virtual Investor Conference December 7ORLANDO, Fla., December 06, 2023--THE LGL GROUP TO PRESENT AT SIDOTI VIRTUAL INVESTOR CONFERENCE DECEMBER 7 |
Sidoti Events, LLC's Virtual December Small-Cap ConferenceNEW YORK, NY / ACCESSWIRE / December 5, 2023 / Sidoti Events, LLC, an affiliate of Sidoti & Company, LLC, has released the presentation schedule and weblinks for its two-day December Small-Cap Conference taking place Wednesday and Thursday, December ... |
The LGL Group Reports Second Quarter 2023 Results, Chairman Marc Gabelli Welcomes the Election of Two Independent Board Members and the Appointment of a CO-CEOORLANDO, Fla., August 23, 2023--THE LGL GROUP REPORTS SECOND QUARTER 2023 RESULTS, CHAIRMAN MARC GABELLI WELCOMES TWO INDEPENDENT BOARD MEMBERS AND APPOINTMENT OF CO-CEO |
The LGL Group Chairman Marc Gabelli Announces the Election of Two Independent Board Members and the Appointment of Co-CEO Timothy Foufas to Help Build Value Across Multiple IndustriesORLANDO, Fla., August 15, 2023--The LGL Group Chairman Marc Gabelli Announces the Election of Two Independent Board Members and the Appointment of Co-CEO Timothy Foufas |
Are There Really Stocks Selling Below The Price Per Cash? Yes.While a high cash per share can be seen as a positive signal, an excessively high amount of cash may also indicate that the company is not effectively deploying its cash. |
LGL Price Returns
| 1-mo | 7.96% |
| 3-mo | -4.71% |
| 6-mo | -13.80% |
| 1-year | 18.05% |
| 3-year | -45.38% |
| 5-year | -31.10% |
| YTD | -9.45% |
| 2023 | 51.60% |
| 2022 | -64.47% |
| 2021 | -9.09% |
| 2020 | -16.40% |
| 2019 | 145.90% |
Continue Researching LGL
Want to see what other sources are saying about Lgl Group Inc's financials and stock price? Try the links below:Lgl Group Inc (LGL) Stock Price | Nasdaq
Lgl Group Inc (LGL) Stock Quote, History and News - Yahoo Finance
Lgl Group Inc (LGL) Stock Price and Basic Information | MarketWatch
Loading social stream, please wait...