Ligand Pharmaceuticals Incorporated (LGND): Price and Financial Metrics
LGND Price/Volume Stats
Current price | $61.49 | 52-week high | $97.65 |
Prev. close | $61.47 | 52-week low | $57.77 |
Day low | $61.31 | Volume | 132,522 |
Day high | $62.73 | Avg. volume | 106,857 |
50-day MA | $65.08 | Dividend yield | N/A |
200-day MA | $70.29 | Market Cap | 1.07B |
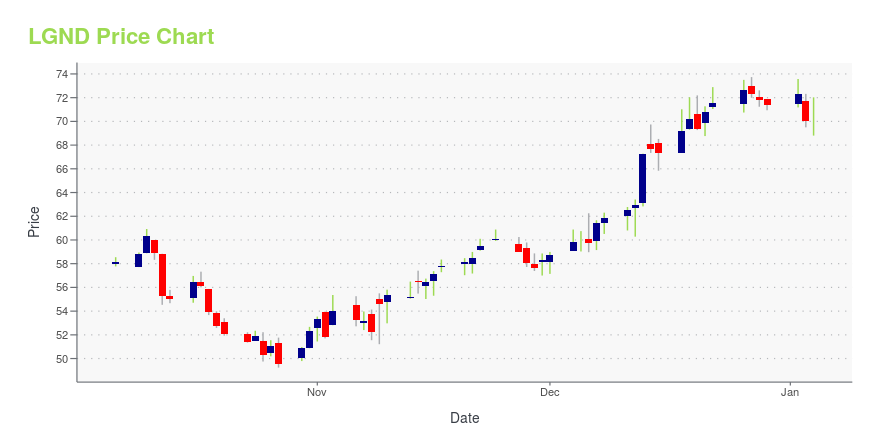
LGND Stock Price Chart Interactive Chart >
LGND POWR Grades
- LGND scores best on the Quality dimension, with a Quality rank ahead of 80.34% of US stocks.
- The strongest trend for LGND is in Stability, which has been heading up over the past 177 days.
- LGND ranks lowest in Momentum; there it ranks in the 7th percentile.
LGND Stock Summary
- With a year-over-year growth in debt of -91.93%, LIGAND PHARMACEUTICALS INC's debt growth rate surpasses just 1.29% of about US stocks.
- In terms of twelve month growth in earnings before interest and taxes, LIGAND PHARMACEUTICALS INC is reporting a growth rate of -3,708.44%; that's higher than just 0.36% of US stocks.
- As for revenue growth, note that LGND's revenue has grown -32% over the past 12 months; that beats the revenue growth of merely 8.2% of US companies in our set.
- Stocks that are quantitatively similar to LGND, based on their financial statements, market capitalization, and price volatility, are MAX, SII, BRDG, EXPI, and OWL.
- LGND's SEC filings can be seen here. And to visit LIGAND PHARMACEUTICALS INC's official web site, go to www.ligand.com.
LGND Valuation Summary
- LGND's price/sales ratio is 6.3; this is 231.58% higher than that of the median Healthcare stock.
- LGND's price/sales ratio has moved down 2 over the prior 243 months.
Below are key valuation metrics over time for LGND.
Stock | Date | P/S | P/B | P/E | EV/EBIT |
---|---|---|---|---|---|
LGND | 2023-09-22 | 6.3 | 1.5 | 37.8 | 11.6 |
LGND | 2023-09-21 | 6.3 | 1.5 | 37.9 | 11.7 |
LGND | 2023-09-20 | 6.5 | 1.6 | 39.0 | 12.0 |
LGND | 2023-09-19 | 6.7 | 1.7 | 40.5 | 12.5 |
LGND | 2023-09-18 | 6.6 | 1.6 | 40.0 | 12.3 |
LGND | 2023-09-15 | 6.6 | 1.6 | 39.6 | 12.2 |
LGND Growth Metrics
- Its year over year cash and equivalents growth rate is now at -52.93%.
- Its 4 year net cashflow from operations growth rate is now at -177.82%.
- The 2 year net income to common stockholders growth rate now stands at 138.66%.

The table below shows LGND's growth in key financial areas (numbers in millions of US dollars).
Date | Revenue | Operating Cash Flow | Net Income to Common Stock |
---|---|---|---|
2022-09-30 | 241.673 | 112.02 | -21.292 |
2022-06-30 | 240.42 | 111.556 | -7.973 |
2022-03-31 | 267.676 | 120.055 | 23.647 |
2021-12-31 | 277.133 | 78.798 | 57.138 |
2021-09-30 | 274.65 | 51.693 | 68.315 |
2021-06-30 | 251.663 | 44.413 | 47.891 |
LGND's Quality Factors
The “Quality” component of the POWR Ratings focuses on 31 different factors of a companies fundamentals and operational strength. Here are some key insights as we drill into the specifics of these quality attributes.- LGND has a Quality Grade of C, ranking ahead of 59.87% of graded US stocks.
- LGND's asset turnover comes in at 0.195 -- ranking 202nd of 681 Pharmaceutical Products stocks.
- NBIX, IRWD, and MNKD are the stocks whose asset turnover ratios are most correlated with LGND.
The table below shows LGND's key quality metrics over time.
Period | Asset Turnover | Gross Margin | ROIC |
---|---|---|---|
2021-06-30 | 0.195 | 0.774 | 0.067 |
2021-03-31 | 0.162 | 0.837 | 0.054 |
2020-12-31 | 0.148 | 0.837 | 0.016 |
2020-09-30 | 0.111 | 0.856 | 0.006 |
2020-06-30 | 0.092 | 0.862 | 0.002 |
2020-03-31 | 0.073 | 0.889 | -0.026 |
LGND Price Target
For more insight on analysts targets of LGND, see our LGND price target page. And for a list of of all stocks sorted by upside potential based on analyst target price, see our Top Price Target page.
Average Price Target | $207.00 | Average Broker Recommendation | 1.43 (Moderate Buy) |
Ligand Pharmaceuticals Incorporated (LGND) Company Bio
Ligand Pharmaceuticals develops therapies that address the unmet medical needs of patients for a range of diseases, including hepatitis, multiple myeloma, muscle wasting, Alzheimers disease, dyslipidemia, diabetes, anemia, epilepsy, focal segmental glomerulosclerosis, and osteoporosis. The company was founded in 1987 and is based in La Jolla, California.
Latest LGND News From Around the Web
Below are the latest news stories about LIGAND PHARMACEUTICALS INC that investors may wish to consider to help them evaluate LGND as an investment opportunity.
Read More 'LGND' Stories HereLGND Price Returns
1-mo | -4.47% |
3-mo | -14.72% |
6-mo | -16.41% |
1-year | -27.82% |
3-year | -35.78% |
5-year | -77.60% |
YTD | -7.95% |
2022 | -56.75% |
2021 | 55.31% |
2020 | -4.64% |
2019 | -23.15% |
2018 | -0.90% |
Continue Researching LGND
Want to do more research on Ligand Pharmaceuticals Inc's stock and its price? Try the links below:Ligand Pharmaceuticals Inc (LGND) Stock Price | Nasdaq
Ligand Pharmaceuticals Inc (LGND) Stock Quote, History and News - Yahoo Finance
Ligand Pharmaceuticals Inc (LGND) Stock Price and Basic Information | MarketWatch
Loading social stream, please wait...