
Lichen China Ltd. (LICN): Price and Financial Metrics
LICN Price/Volume Stats
| Current price | $3.36 | 52-week high | $488.00 |
| Prev. close | $3.65 | 52-week low | $3.31 |
| Day low | $3.31 | Volume | 26,800 |
| Day high | $3.74 | Avg. volume | 93,862 |
| 50-day MA | $10.04 | Dividend yield | N/A |
| 200-day MA | $233.32 | Market Cap | 2.01M |
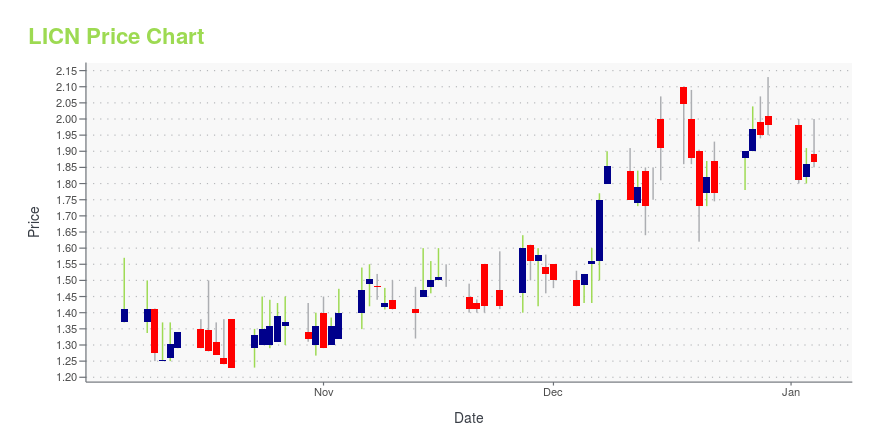
LICN Stock Price Chart Interactive Chart >
LICN Price Returns
| 1-mo | -40.53% |
| 3-mo | -90.72% |
| 6-mo | -99.07% |
| 1-year | -98.37% |
| 3-year | N/A |
| 5-year | N/A |
| YTD | -90.54% |
| 2024 | -91.03% |
| 2023 | N/A |
| 2022 | N/A |
| 2021 | N/A |
| 2020 | N/A |
Loading social stream, please wait...