
Lichen China Ltd. (LICN): Price and Financial Metrics
LICN Price/Volume Stats
| Current price | $2.02 | 52-week high | $2.30 |
| Prev. close | $2.02 | 52-week low | $0.50 |
| Day low | $1.98 | Volume | 6,472 |
| Day high | $2.06 | Avg. volume | 552,758 |
| 50-day MA | $1.61 | Dividend yield | N/A |
| 200-day MA | $1.42 | Market Cap | 53.53M |
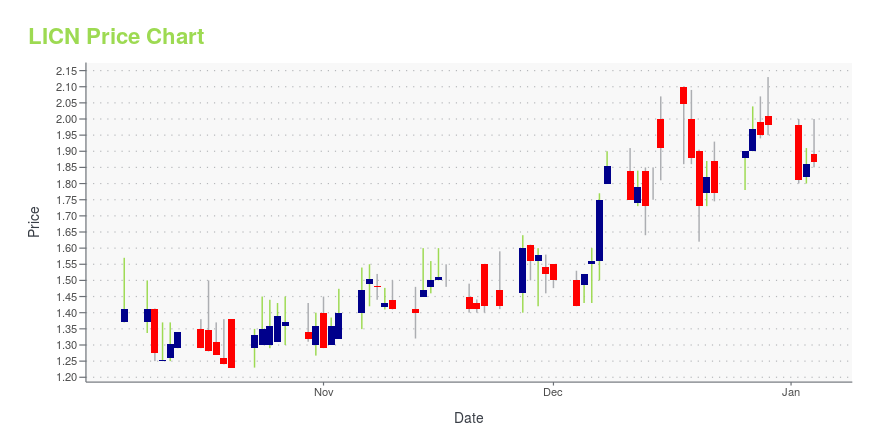
LICN Stock Price Chart Interactive Chart >
Latest LICN News From Around the Web
Below are the latest news stories about LICHEN CHINA LTD that investors may wish to consider to help them evaluate LICN as an investment opportunity.
How Good Is Lichen China Limited (NASDAQ:LICN), When It Comes To ROE?One of the best investments we can make is in our own knowledge and skill set. With that in mind, this article will... |
Univest Securities, LLC Announces Closing of $16 Million Initial Public Offering of Class A Ordinary Shares for its Client Lichen China Limited (NASDAQ: LICN)New York, Feb. 08, 2023 (GLOBE NEWSWIRE) -- Univest Securities, LLC (“Univest”), a member of FINRA and SIPC, and a full-service investment bank and securities broker-dealer firm based in New York, today announced the closing of an initial public offering (the “Offering”) of 4,000,000 Class A ordinary shares at a public offering price of US$4.00 per Class A ordinary share for its client Lichen China Limited (“Lichen” or the “Company”) (NASDAQ: LICN), a dedicated financial and taxation service pro |
Lichen China Limited Announces Closing of US$16 Million Initial Public OfferingLichen China Limited (the "Company" or "Lichen China"), a dedicated financial and taxation service provider in China, today announced the pricing of its initial public offering (the "Offering") of 4,000,000 Class A ordinary shares at a public offering price of US$4.00 per Class A ordinary share. The Class A ordinary shares began trading on the Nasdaq Capital Market on February 6, 2023 under the ticker symbol "LICN." |
Lichen China Limited Announces Pricing of US$16 Million Initial Public OfferingLichen China Limited (the "Company" or "Lichen China"), a dedicated financial and taxation service provider in China, today announced the pricing of its initial public offering (the "Offering") of 4,000,000 Class A ordinary shares at a public offering price of US$4.00 per Class A ordinary share. The Class A ordinary shares have been approved for listing on the Nasdaq Capital Market and are expected to commence trading on February 6, 2023 under the ticker symbol "LICN." |
LICN Price Returns
| 1-mo | 42.25% |
| 3-mo | 47.45% |
| 6-mo | 20.24% |
| 1-year | 64.23% |
| 3-year | N/A |
| 5-year | N/A |
| YTD | 2.02% |
| 2023 | N/A |
| 2022 | N/A |
| 2021 | N/A |
| 2020 | N/A |
| 2019 | N/A |
Loading social stream, please wait...