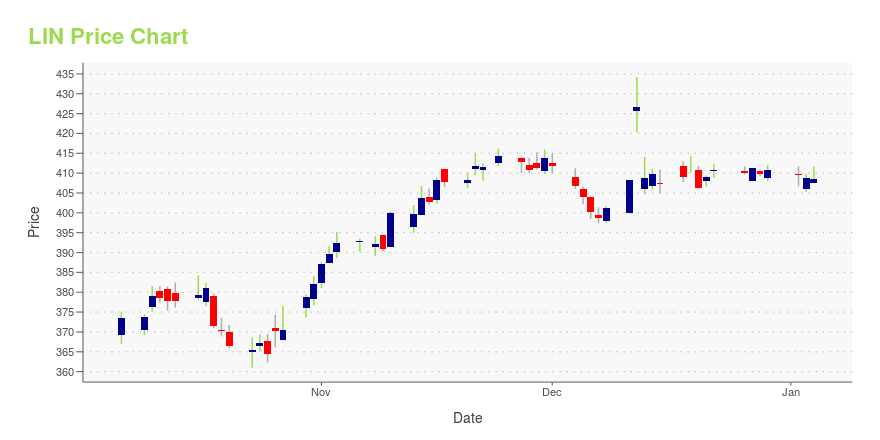
Linde PLC (LIN): Price and Financial Metrics
LIN Price/Volume Stats
| Current price | $443.85 | 52-week high | $487.49 |
| Prev. close | $452.12 | 52-week low | $408.65 |
| Day low | $440.27 | Volume | 1,303,400 |
| Day high | $452.47 | Avg. volume | 2,438,485 |
| 50-day MA | $456.50 | Dividend yield | 1.34% |
| 200-day MA | $453.82 | Market Cap | 209.90B |
LIN Stock Price Chart Interactive Chart >
Linde PLC (LIN) Company Bio
Linde plc is a multinational chemical company with German-American roots. It is the largest industrial gas company by market share and revenue. It serves customers in the healthcare, petroleum refining, manufacturing, food, beverage carbonation, fiber-optics, steel making, aerospace, chemicals, electronics and water treatment industries.[1] The company's primary business is the manufacturing and distribution of atmospheric gases, including oxygen, nitrogen, argon, rare gases, and process gases, including carbon dioxide, helium, hydrogen, electronic gases, specialty gases, and acetylene . (Source:Wikipedia)
LIN Price Returns
| 1-mo | -3.16% |
| 3-mo | 0.65% |
| 6-mo | -6.44% |
| 1-year | 0.70% |
| 3-year | 49.23% |
| 5-year | 162.44% |
| YTD | 6.37% |
| 2024 | 3.18% |
| 2023 | 27.66% |
| 2022 | -4.39% |
| 2021 | 33.39% |
| 2020 | 25.29% |
LIN Dividends
| Ex-Dividend Date | Type | Payout Amount | Change | ||||||
|---|---|---|---|---|---|---|---|---|---|
| Loading, please wait... | |||||||||


Loading social stream, please wait...