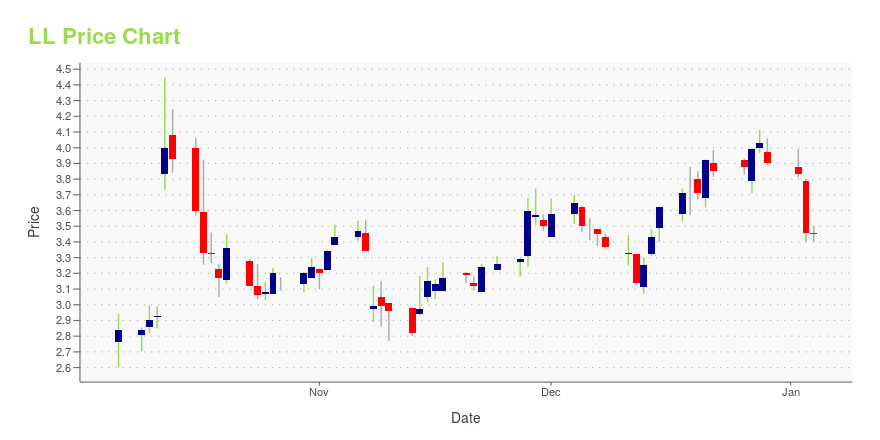
Lumber Liquidators Holdings Inc. (LL): Price and Financial Metrics
GET POWR RATINGS... FREE!
LL POWR Grades
- Value is the dimension where LL ranks best; there it ranks ahead of 91.49% of US stocks.
- The strongest trend for LL is in Quality, which has been heading down over the past 179 days.
- LL's current lowest rank is in the Growth metric (where it is better than 16.03% of US stocks).
LL Stock Summary
- LL's price/sales ratio is 0.4; that's higher than the P/S ratio of merely 8.4% of US stocks.
- With a year-over-year growth in debt of -41.92%, LL Flooring Holdings Inc's debt growth rate surpasses only 9.71% of about US stocks.
- LL Flooring Holdings Inc's shareholder yield -- a measure of how much capital is returned to stockholders via dividends and buybacks -- is 22.51%, greater than the shareholder yield of 92.23% of stocks in our set.
- If you're looking for stocks that are quantitatively similar to LL Flooring Holdings Inc, a group of peers worth examining would be FORD, NUS, UBOH, MYE, and HIL.
- Visit LL's SEC page to see the company's official filings. To visit the company's web site, go to www.lumberliquidators.com.
LL Valuation Summary
- LL's price/sales ratio is 0.5; this is 83.87% lower than that of the median Consumer Cyclical stock.
- Over the past 168 months, LL's price/sales ratio has gone down 0.3.
- LL's EV/EBIT ratio has moved down 3.6 over the prior 168 months.
Below are key valuation metrics over time for LL.
Stock | Date | P/S | P/B | P/E | EV/EBIT |
---|---|---|---|---|---|
LL | 2021-08-27 | 0.5 | 2.4 | 8.6 | 8.6 |
LL | 2021-08-26 | 0.5 | 2.3 | 8.4 | 8.4 |
LL | 2021-08-25 | 0.5 | 2.4 | 8.7 | 8.7 |
LL | 2021-08-24 | 0.5 | 2.4 | 8.7 | 8.7 |
LL | 2021-08-23 | 0.5 | 2.3 | 8.4 | 8.5 |
LL | 2021-08-20 | 0.5 | 2.3 | 8.4 | 8.4 |
LL Growth Metrics
- Its year over year net cashflow from operations growth rate is now at 455.31%.
- Its 2 year net cashflow from operations growth rate is now at -45.06%.
- Its 5 year price growth rate is now at -19.05%.

The table below shows LL's growth in key financial areas (numbers in millions of US dollars).
Date | Revenue | Operating Cash Flow | Net Income to Common Stock |
---|---|---|---|
2021-12-31 | 1,152.344 | 38.67 | 41.698 |
2021-09-30 | 1,171.274 | 26.564 | 62.44 |
2021-06-30 | 1,184.878 | 104.713 | 69.164 |
2021-03-31 | 1,113.778 | 165.576 | 59.814 |
2020-12-31 | 1,097.702 | 157.046 | 61.427 |
2020-09-30 | 1,067.345 | 198.166 | 46.775 |
LL's Quality Factors
The “Quality” component of the POWR Ratings focuses on 31 different factors of a companies fundamentals and operational strength. Here are some key insights as we drill into the specifics of these quality attributes.- LL has a Quality Grade of B, ranking ahead of 94.08% of graded US stocks.
- LL's asset turnover comes in at 1.775 -- ranking 61st of 165 Retail stocks.
- URBN, CHS, and TJX are the stocks whose asset turnover ratios are most correlated with LL.
The table below shows LL's key quality metrics over time.
Period | Asset Turnover | Gross Margin | ROIC |
---|---|---|---|
2021-06-30 | 1.775 | 0.391 | 0.166 |
2021-03-31 | 1.628 | 0.394 | 0.129 |
2020-12-31 | 1.666 | 0.390 | 0.112 |
2020-09-30 | 1.669 | 0.395 | 0.108 |
2020-06-30 | 1.709 | 0.387 | 0.063 |
2020-03-31 | 1.872 | 0.379 | 0.048 |
LL Price Target
For more insight on analysts targets of LL, see our LL price target page. And for a list of of all stocks sorted by upside potential based on analyst target price, see our Top Price Target page.
Average Price Target | $20.50 | Average Broker Recommendation | 2 (Hold) |
LL Stock Price Chart Interactive Chart >
LL Price/Volume Stats
Current price | $12.35 | 52-week high | $23.70 |
Prev. close | $12.02 | 52-week low | $10.54 |
Day low | $12.08 | Volume | 245,800 |
Day high | $12.36 | Avg. volume | 287,092 |
50-day MA | $13.44 | Dividend yield | N/A |
200-day MA | $16.34 | Market Cap | 367.77M |
Lumber Liquidators Holdings Inc. (LL) Company Bio
Lumber Liquidators Holdings, Inc. operates as a multi channel specialty retailer of hardwood flooring and hardwood flooring enhancements and accessories in the United States. The firm offers exotic and domestic hardwood species, engineered hardwood, laminate, vinyl plank, bamboo and cork direct to the consumer. It also provides flooring enhancements and accessories, including moldings, noise reducing underlay, adhesives and flooring tools. The company was founded by Thomas David Sullivan in 1994 and is headquartered in Richmond, VA.
Latest LL News From Around the Web
Below are the latest news stories about LL Flooring Holdings Inc that investors may wish to consider to help them evaluate LL as an investment opportunity.
LL Flooring Holdings stock higher after Q4 resultsLL Flooring Holdings (LL +17.4%) reports net sales decreased 6.2% Y/Y, as double-digit growth in sales to Pro customers and a 6.4% increase in net services sales partially offset a decrease in DIY sales; and increased 4.2% vs. 4Q19, also driven primarily by double-digit growth in sales to Pro customers... |
Lumber Liquidators Non-GAAP EPS of $0.35 beats by $0.11, revenue of $285.28M misses by $10.22MLumber Liquidators press release (NYSE:LL): Q4 Non-GAAP EPS of $0.35 beats by $0.11. Revenue of $285.28M (-6.2% Y/Y) misses by $10.22M. During the fourth quarter, the Company opened two new stores, bringing total stores to 424 as of December 31, 2021. Operating margin of 3.8% decreased 220 basis points compared... |
LL Flooring (LL) Surpasses Q4 Earnings EstimatesLumber Liquidators (LL) delivered earnings and revenue surprises of 84.21% and 3.59%, respectively, for the quarter ended December 2021. Do the numbers hold clues to what lies ahead for the stock? |
LL Flooring profit, sales and gross margin all fall, and financial guidance not providedLL Flooring Holdings Inc. , formerly known as Lumber Liquidators, reported Wednesday fourth-quarter earnings that were about one-third what they were a year ago, and sales that fell 6.2% and gross margin that decreased by 150 basis points. The hard-surface flooring company said net income fell to $10.3 million, or 35 cents a share, from $31.1 million, or $1.05 a share, in the year ago period. Excluding nonrecurring items, adjusted EPS fell to 35 cents from $1.03. Sales fell to $285.3 million fro |
LL Flooring Reports Fourth Quarter and Full Year 2021 Financial ResultsRICHMOND, Va., February 23, 2022--LL Flooring Announces Fourth Quarter and Full Year 2021 Results |
LL Price Returns
1-mo | -11.41% |
3-mo | -22.13% |
6-mo | -22.13% |
1-year | -45.79% |
3-year | 25.13% |
5-year | -58.70% |
YTD | -27.65% |
2021 | -44.47% |
2020 | 214.64% |
2019 | 2.63% |
2018 | -69.67% |
2017 | 99.43% |
Continue Researching LL
Want to do more research on Lumber Liquidators Holdings Inc's stock and its price? Try the links below:Lumber Liquidators Holdings Inc (LL) Stock Price | Nasdaq
Lumber Liquidators Holdings Inc (LL) Stock Quote, History and News - Yahoo Finance
Lumber Liquidators Holdings Inc (LL) Stock Price and Basic Information | MarketWatch
Loading social stream, please wait...