Eli Lilly & Co. (LLY): Price and Financial Metrics
LLY Price/Volume Stats
Current price | $550.54 | 52-week high | $601.84 |
Prev. close | $550.13 | 52-week low | $304.88 |
Day low | $547.63 | Volume | 2,354,100 |
Day high | $555.49 | Avg. volume | 3,028,263 |
50-day MA | $522.39 | Dividend yield | 0.79% |
200-day MA | $416.03 | Market Cap | 522.62B |
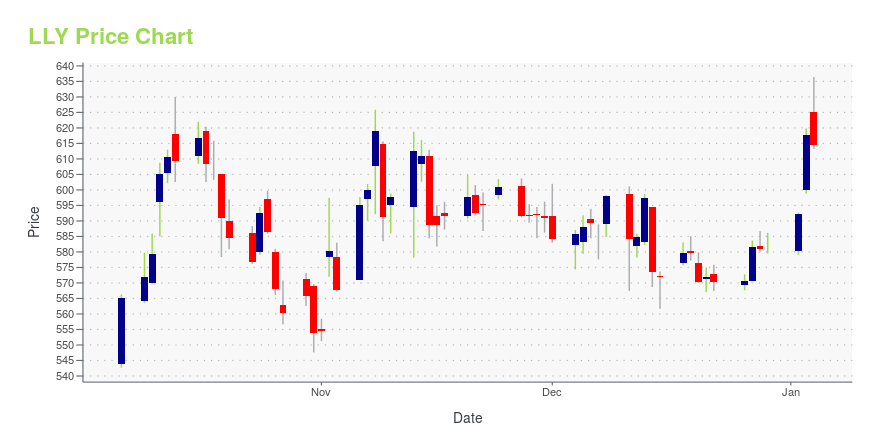
LLY Stock Price Chart Interactive Chart >
LLY POWR Grades
- LLY scores best on the Growth dimension, with a Growth rank ahead of 95.16% of US stocks.
- LLY's strongest trending metric is Growth; it's been moving up over the last 179 days.
- LLY's current lowest rank is in the Momentum metric (where it is better than 9.4% of US stocks).
LLY Stock Summary
- LLY has a market capitalization of $542,313,346,431 -- more than approximately 99.81% of US stocks.
- Price to trailing twelve month operating cash flow for LLY is currently 88.51, higher than 96.91% of US stocks with positive operating cash flow.
- With a price/sales ratio of 18.37, ELI LILLY & CO has a higher such ratio than 94.13% of stocks in our set.
- If you're looking for stocks that are quantitatively similar to ELI LILLY & CO, a group of peers worth examining would be TSM, JNJ, XOM, V, and AVGO.
- LLY's SEC filings can be seen here. And to visit ELI LILLY & CO's official web site, go to www.lilly.com.
LLY Valuation Summary
- LLY's price/earnings ratio is 83.5; this is 206.42% higher than that of the median Healthcare stock.
- LLY's price/earnings ratio has moved up 57.1 over the prior 243 months.
Below are key valuation metrics over time for LLY.
Stock | Date | P/S | P/B | P/E | EV/EBIT |
---|---|---|---|---|---|
LLY | 2023-09-18 | 18.4 | 49.0 | 83.5 | 76.7 |
LLY | 2023-09-15 | 18.5 | 49.4 | 84.1 | 77.3 |
LLY | 2023-09-14 | 19.0 | 50.8 | 86.4 | 79.4 |
LLY | 2023-09-13 | 19.3 | 51.4 | 87.5 | 80.3 |
LLY | 2023-09-12 | 19.3 | 51.4 | 87.6 | 80.4 |
LLY | 2023-09-11 | 19.2 | 51.1 | 87.0 | 79.9 |
LLY Growth Metrics
- The 5 year revenue growth rate now stands at 6.96%.
- The year over year net cashflow from operations growth rate now stands at 3.17%.
- Its 4 year price growth rate is now at 87.77%.

The table below shows LLY's growth in key financial areas (numbers in millions of US dollars).
Date | Revenue | Operating Cash Flow | Net Income to Common Stock |
---|---|---|---|
2022-12-31 | 28,541.4 | 7,084.4 | 6,244.8 |
2022-09-30 | 29,239.5 | 7,661.2 | 6,033.2 |
2022-06-30 | 29,070.7 | 7,107.7 | 5,691.6 |
2022-03-31 | 29,322.8 | 8,062.5 | 6,129.3 |
2021-12-31 | 28,318.4 | 7,260.7 | 5,581.7 |
2021-09-30 | 27,758.5 | 6,919.4 | 5,972.4 |
LLY's Quality Factors
The “Quality” component of the POWR Ratings focuses on 31 different factors of a companies fundamentals and operational strength. Here are some key insights as we drill into the specifics of these quality attributes.- LLY has a Quality Grade of B, ranking ahead of 90.11% of graded US stocks.
- LLY's asset turnover comes in at 0.586 -- ranking 60th of 681 Pharmaceutical Products stocks.
- BHC, VRTX, and DRRX are the stocks whose asset turnover ratios are most correlated with LLY.
The table below shows LLY's key quality metrics over time.
Period | Asset Turnover | Gross Margin | ROIC |
---|---|---|---|
2021-09-30 | 0.586 | 0.748 | 0.191 |
2021-06-30 | 0.577 | 0.743 | 0.199 |
2021-03-31 | 0.568 | 0.759 | 0.203 |
2020-12-31 | 0.565 | 0.777 | 0.214 |
2020-09-30 | 0.558 | 0.783 | 0.198 |
2020-06-30 | 0.573 | 0.787 | 0.202 |
LLY Price Target
For more insight on analysts targets of LLY, see our LLY price target page. And for a list of of all stocks sorted by upside potential based on analyst target price, see our Top Price Target page.
Average Price Target | $265.88 | Average Broker Recommendation | 1.5 (Moderate Buy) |
Eli Lilly & Co. (LLY) Company Bio
Eli Lilly and Company is an American pharmaceutical company headquartered in Indianapolis, Indiana, with offices in 18 countries. Its products are sold in approximately 125 countries. The company was founded in 1876 by, and named after, Col. Eli Lilly, a pharmaceutical chemist and veteran of the American Civil War. (Source:Wikipedia)
Latest LLY News From Around the Web
Below are the latest news stories about ELI LILLY & CO that investors may wish to consider to help them evaluate LLY as an investment opportunity.
Obesity Drug Market Set to Hit $100 Billion by 2035, BMO Says(Bloomberg) -- The global market for novel weight-loss drugs like Novo Nordisk A/S’s Ozempic and Wegovy is poised to reach $100 billion by 2035 as patients start to understand the efficacy of the medications.Most Read from BloombergChina’s Ultra-Rich Gen Zs Flock Home as Global Tensions RiseTreasuries Halt Fed-Fueled Rout as Stocks Struggle: Markets WrapEx-Goldman Bankers Make a Fortune With Controversial Bet on CoalMcCarthy Ambushed as Republican Hardliners Change Course on Spending PlanRaw Mea |
Global Weight-Loss Drug Market Projected to Hit $100 Billion by 2035In a recent forecast, BMO Capital Markets has predicted the global market for innovative weight-loss drugs, such as Novo Nordisk (NYSE:NVO) A/S's Ozempic and Wegovy, to reach $100 billion by 2035. This projection follows an increase in patient recognition of the efficacy of these medications. |
Are Wall Street Analysts Wrong About Eli Lilly Stock?Based on analysts' projections, you might think the pharmaceutical giant isn't worth investing in right now. |
The Zacks Analyst Blog Highlights Eli Lilly, Toyota Motor, Accenture, The Walt Disney and CVS HealthEli Lilly, Toyota Motor, Accenture, The Walt Disney and CVS Health are part of the Zacks top Analyst Blog. |
US FDA approves Jardiance® for the treatment of adults with chronic kidney diseaseThe U.S. Food and Drug Administration (FDA) has approved Jardiance® (empagliflozin) 10 mg tablets to reduce the risk of sustained decline in estimated glomerular filtration rate (eGFR), end-stage kidney disease, cardiovascular death and hospitalization in adults with chronic kidney disease (CKD) at risk of progression, Boehringer Ingelheim and Eli Lilly and Company (NYSE: LLY) announced. |
LLY Price Returns
1-mo | -0.56% |
3-mo | 21.86% |
6-mo | 63.83% |
1-year | 78.67% |
3-year | 285.72% |
5-year | 466.37% |
YTD | 51.69% |
2022 | 34.26% |
2021 | 66.08% |
2020 | 31.04% |
2019 | 16.14% |
2018 | 40.45% |
LLY Dividends
Ex-Dividend Date | Type | Payout Amount | Change | ||||||
---|---|---|---|---|---|---|---|---|---|
Loading, please wait... |
Continue Researching LLY
Want to see what other sources are saying about ELI LILLY & Co's financials and stock price? Try the links below:ELI LILLY & Co (LLY) Stock Price | Nasdaq
ELI LILLY & Co (LLY) Stock Quote, History and News - Yahoo Finance
ELI LILLY & Co (LLY) Stock Price and Basic Information | MarketWatch
Loading social stream, please wait...