
LeMaitre Vascular, Inc. (LMAT): Price and Financial Metrics
LMAT Price/Volume Stats
| Current price | $85.83 | 52-week high | $91.76 |
| Prev. close | $86.24 | 52-week low | $44.27 |
| Day low | $84.94 | Volume | 138,204 |
| Day high | $87.55 | Avg. volume | 124,699 |
| 50-day MA | $81.76 | Dividend yield | 0.71% |
| 200-day MA | $64.87 | Market Cap | 1.93B |
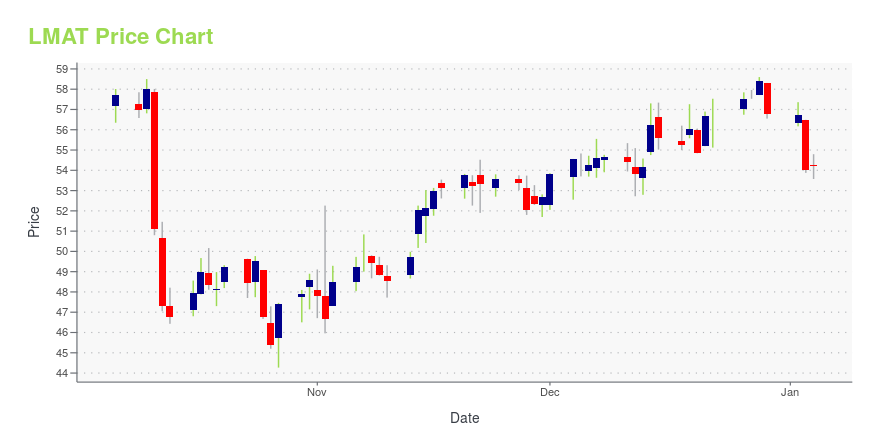
LMAT Stock Price Chart Interactive Chart >
LeMaitre Vascular, Inc. (LMAT) Company Bio
LeMaitre Vascular is a provider of devices and implants for the treatment of peripheral vascular disease. The company was founded in 1983 and is based in Burlington, Massachusetts.
Latest LMAT News From Around the Web
Below are the latest news stories about LEMAITRE VASCULAR INC that investors may wish to consider to help them evaluate LMAT as an investment opportunity.
Insider Sell: Chairman and CEO George Lemaitre Sells 22,288 Shares of LeMaitre Vascular Inc (LMAT)George Lemaitre, the Chairman and CEO, as well as a 10% Owner of LeMaitre Vascular Inc (NASDAQ:LMAT), has recently sold 22,288 shares of the company's stock. |
LeMaitre Vascular Inc's CEO George Lemaitre Sells Shares: An Insider AnalysisGeorge Lemaitre, Chairman, CEO, and 10% Owner of LeMaitre Vascular Inc (NASDAQ:LMAT), has recently sold 50,995 shares of the company's stock on December 8, 2023. |
ESLOY or LMAT: Which Is the Better Value Stock Right Now?ESLOY vs. LMAT: Which Stock Is the Better Value Option? |
Sidoti Events, LLC's Virtual December Small-Cap ConferenceNEW YORK, NY / ACCESSWIRE / December 5, 2023 / Sidoti Events, LLC, an affiliate of Sidoti & Company, LLC, has released the presentation schedule and weblinks for its two-day December Small-Cap Conference taking place Wednesday and Thursday, December ... |
How Much Upside is Left in LeMaitre (LMAT)? Wall Street Analysts Think 25.24%The consensus price target hints at a 25.2% upside potential for LeMaitre (LMAT). While empirical research shows that this sought-after metric is hardly effective, an upward trend in earnings estimate revisions could mean that the stock will witness an upside in the near term. |
LMAT Price Returns
| 1-mo | 4.81% |
| 3-mo | 31.39% |
| 6-mo | 52.27% |
| 1-year | 38.48% |
| 3-year | 63.22% |
| 5-year | 177.28% |
| YTD | 51.89% |
| 2023 | 24.60% |
| 2022 | -7.40% |
| 2021 | 25.10% |
| 2020 | 14.09% |
| 2019 | 53.77% |
LMAT Dividends
| Ex-Dividend Date | Type | Payout Amount | Change | ||||||
|---|---|---|---|---|---|---|---|---|---|
| Loading, please wait... | |||||||||
Continue Researching LMAT
Here are a few links from around the web to help you further your research on Lemaitre Vascular Inc's stock as an investment opportunity:Lemaitre Vascular Inc (LMAT) Stock Price | Nasdaq
Lemaitre Vascular Inc (LMAT) Stock Quote, History and News - Yahoo Finance
Lemaitre Vascular Inc (LMAT) Stock Price and Basic Information | MarketWatch
Loading social stream, please wait...