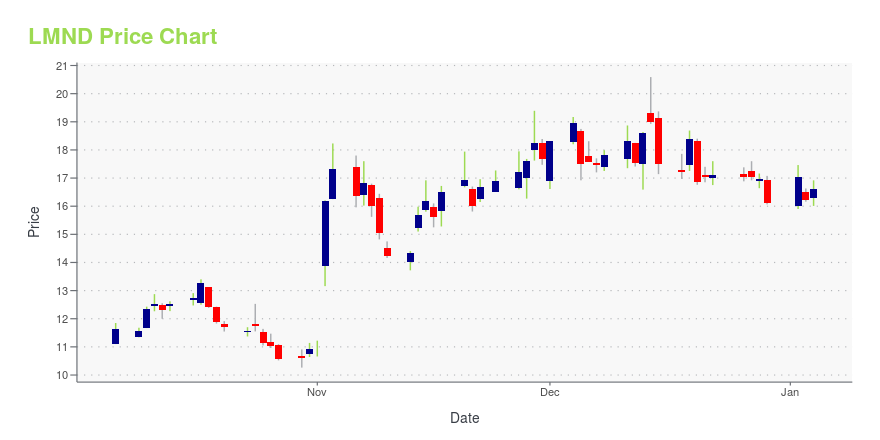
Lemonade Inc. (LMND): Price and Financial Metrics
LMND Price/Volume Stats
| Current price | $23.42 | 52-week high | $24.55 |
| Prev. close | $22.70 | 52-week low | $10.27 |
| Day low | $22.62 | Volume | 1,234,000 |
| Day high | $23.69 | Avg. volume | 1,680,654 |
| 50-day MA | $17.76 | Dividend yield | N/A |
| 200-day MA | $16.69 | Market Cap | 1.65B |
LMND Stock Price Chart Interactive Chart >
Lemonade Inc. (LMND) Company Bio
Lemonade, Inc. is an insurance holding company, which engages in the provision of home and renters insurance services. The firm also acts as an insurance agent that offers underwriting and claims services through its subsidiary. It also provides personnel, facilities, and services to each of its subsidiaries.
Latest LMND News From Around the Web
Below are the latest news stories about LEMONADE INC that investors may wish to consider to help them evaluate LMND as an investment opportunity.
15 Best Pet Insurance Companies Heading into 2024In this article, we will cover the 15 best pet insurance companies heading into 2024. If you want to skip our detailed analysis of the pet insurance market, you can go directly to 5 Best Pet Insurance Companies Heading into 2024. The Global Pet Insurance Market: An Analysis Driven by economic trends, increasing pet adoption, […] |
2 Small-Cap Stocks Wall Street Left Behind, but That Could Explode in 2024Both of these companies are worth less than $1.2 billion, but they might not be for long. |
Lemonade, Inc.'s (NYSE:LMND) P/S Is On The MarkWhen close to half the companies in the Insurance industry in the United States have price-to-sales ratios (or "P/S... |
Gen Z Investors: 2 Top Tech Stocks to Buy NowIf you're a Gen Zer, it makes sense to invest in riskier, high-growth stocks. |
7 AI Stocks to Turn $50,000 Into $1 Million: December 2023Explore the top AI stocks to buy offering monstrous long-term upside potential ahead for those that can stomach the volatility |
LMND Price Returns
| 1-mo | 42.03% |
| 3-mo | 30.47% |
| 6-mo | 41.60% |
| 1-year | 12.81% |
| 3-year | -73.20% |
| 5-year | N/A |
| YTD | 45.20% |
| 2023 | 17.91% |
| 2022 | -67.51% |
| 2021 | -65.62% |
| 2020 | N/A |
| 2019 | N/A |


Loading social stream, please wait...