
Cheniere Energy Inc. (LNG): Price and Financial Metrics
LNG Price/Volume Stats
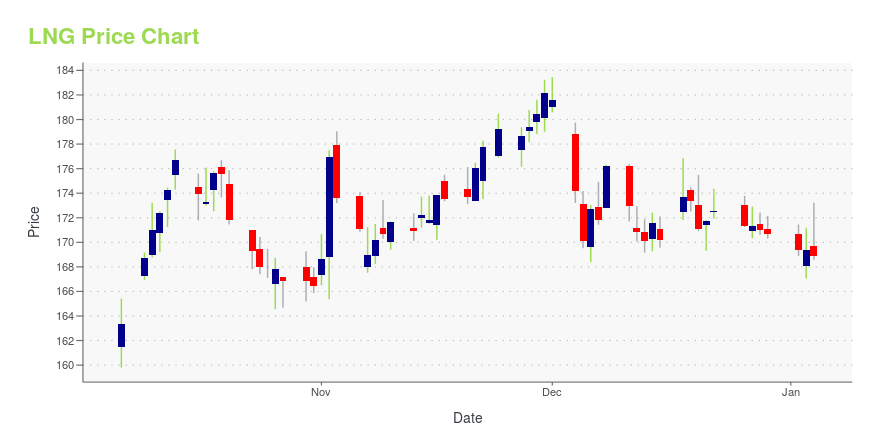
| Current price | $176.72 | 52-week high | $184.62 |
| Prev. close | $176.35 | 52-week low | $152.31 |
| Day low | $175.50 | Volume | 1,231,800 |
| Day high | $177.89 | Avg. volume | 1,899,641 |
| 50-day MA | $166.87 | Dividend yield | 0.98% |
| 200-day MA | $165.25 | Market Cap | 40.45B |
LNG Stock Price Chart Interactive Chart >
Cheniere Energy Inc. (LNG) Company Bio
Cheniere Energy, Inc. is a liquefied natural gas (LNG) company headquartered in Houston, Texas. In February 2016 it became the first US company to export liquefied natural gas. As of 2018 it is a Fortune 500 company. (Source:Wikipedia)
Latest LNG News From Around the Web
Below are the latest news stories about CHENIERE ENERGY INC that investors may wish to consider to help them evaluate LNG as an investment opportunity.
LNG developer Tellurian hires financial adviserHOUSTON (Reuters) -Struggling liquefied natural gas (LNG) developer Tellurian on Thursday said it has hired a financial adviser to assist in balance sheet management. Tellurian ousted its chairman and co-founder Charif Souki, earlier this month weeks after auditors raised doubts about the company's ability to cover future expenses. Chairman Martin Houston in a letter to shareholders said the adviser will "assist with shaping commercial structures as well as balance sheet management." |
16 Most Promising Dividend Stocks According to AnalystsIn this article, we discuss 16 most promising dividend stocks according to analysts. You can skip our detailed analysis of dividend stocks and their performance over the years, and go directly to read 5 Most Promising Dividend Stocks According to Analysts. This year brought a notable shift in the investment scene, where technology stocks surged […] |
LNG pioneer Charif Souki leaves Tellurian with $8mn after oustingCharif Souki, a pioneer of the US liquefied natural gas industry, will receive a payout of more than $8mn after being ousted from project developer Tellurian as the company struggles to get a costly gas export project off the ground. Tellurian, co-founded by Souki in 2016, said in a regulatory filing on Wednesday that he had resigned from its board of directors effective this week. The announcement came after he was terminated as executive chair earlier this month “without cause”, according to the company. |
EXPLAINER-How would the Red Sea attacks affect gas shipping?Several shipping companies and a few liquefied natural gas (LNG) tankers have decided to avoid the world's main East-West trade route, following attacks launched by Yemen's Houthi group on commercial ships at the southern end of the Red Sea. IS THE RED SEA ROUTE IMPORTANT FOR THE LNG MARKET? The attacks have made reaching the Suez Canal more perilous. |
Here's Why Cheniere Energy (LNG) is a Strong Value StockWondering how to pick strong, market-beating stocks for your investment portfolio? Look no further than the Zacks Style Scores. |
LNG Price Returns
| 1-mo | 2.62% |
| 3-mo | 11.36% |
| 6-mo | 6.65% |
| 1-year | 11.96% |
| 3-year | 113.51% |
| 5-year | 178.57% |
| YTD | 4.09% |
| 2023 | 15.02% |
| 2022 | 49.30% |
| 2021 | 69.48% |
| 2020 | -1.70% |
| 2019 | 3.18% |
LNG Dividends
| Ex-Dividend Date | Type | Payout Amount | Change | ||||||
|---|---|---|---|---|---|---|---|---|---|
| Loading, please wait... | |||||||||
Continue Researching LNG
Here are a few links from around the web to help you further your research on Cheniere Energy Inc's stock as an investment opportunity:Cheniere Energy Inc (LNG) Stock Price | Nasdaq
Cheniere Energy Inc (LNG) Stock Quote, History and News - Yahoo Finance
Cheniere Energy Inc (LNG) Stock Price and Basic Information | MarketWatch
Loading social stream, please wait...