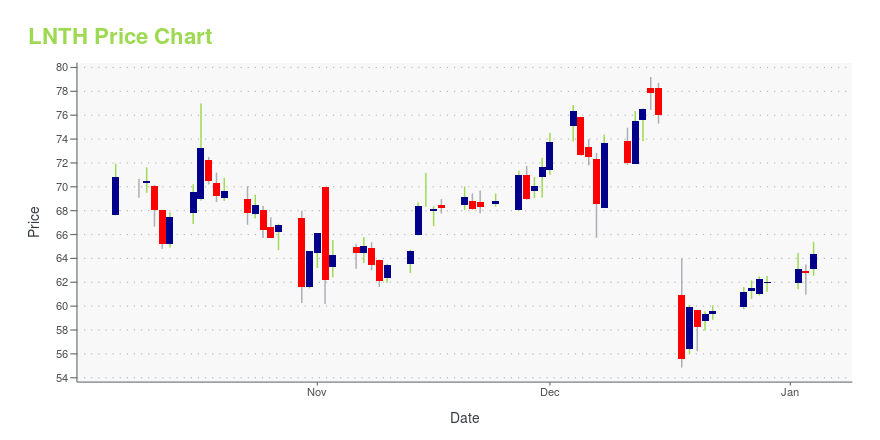
Lantheus Holdings, Inc. (LNTH): Price and Financial Metrics
LNTH Price/Volume Stats
Current price | $60.38 | 52-week high | $100.85 |
Prev. close | $61.96 | 52-week low | $47.46 |
Day low | $60.15 | Volume | 381,068 |
Day high | $61.76 | Avg. volume | 1,014,139 |
50-day MA | $72.58 | Dividend yield | N/A |
200-day MA | $73.87 | Market Cap | 4.13B |
LNTH Stock Price Chart Interactive Chart >
LNTH POWR Grades
- Growth is the dimension where LNTH ranks best; there it ranks ahead of 82.93% of US stocks.
- The strongest trend for LNTH is in Sentiment, which has been heading down over the past 179 days.
- LNTH's current lowest rank is in the Momentum metric (where it is better than 7.42% of US stocks).
LNTH Stock Summary
- With a price/earnings ratio of 131.44, LANTHEUS HOLDINGS INC P/E ratio is greater than that of about 96.02% of stocks in our set with positive earnings.
- With a year-over-year growth in debt of 229.71%, LANTHEUS HOLDINGS INC's debt growth rate surpasses 94.97% of about US stocks.
- As for revenue growth, note that LNTH's revenue has grown 69.36% over the past 12 months; that beats the revenue growth of 92.2% of US companies in our set.
- Stocks that are quantitatively similar to LNTH, based on their financial statements, market capitalization, and price volatility, are IMGN, INCY, PXLW, ADAP, and ABEO.
- Visit LNTH's SEC page to see the company's official filings. To visit the company's web site, go to www.lantheus.com.
LNTH Valuation Summary
- LNTH's price/earnings ratio is 131.4; this is 382.2% higher than that of the median Healthcare stock.
- LNTH's price/earnings ratio has moved up 181.6 over the prior 100 months.
Below are key valuation metrics over time for LNTH.
Stock | Date | P/S | P/B | P/E | EV/EBIT |
---|---|---|---|---|---|
LNTH | 2023-09-18 | 3.9 | 7.9 | 131.4 | 135.3 |
LNTH | 2023-09-15 | 3.9 | 8.0 | 132.9 | 136.8 |
LNTH | 2023-09-14 | 4.0 | 8.2 | 136.1 | 139.9 |
LNTH | 2023-09-13 | 3.8 | 7.7 | 128.0 | 131.9 |
LNTH | 2023-09-12 | 3.9 | 7.9 | 131.4 | 135.3 |
LNTH | 2023-09-11 | 4.0 | 8.1 | 134.0 | 137.9 |
LNTH Growth Metrics
- The 5 year price growth rate now stands at 1.16%.
- The 4 year net income to common stockholders growth rate now stands at 21.76%.
- Its 4 year revenue growth rate is now at 14.6%.

The table below shows LNTH's growth in key financial areas (numbers in millions of US dollars).
Date | Revenue | Operating Cash Flow | Net Income to Common Stock |
---|---|---|---|
2022-09-30 | 801.457 | 190.318 | 107.037 |
2022-06-30 | 664.238 | 101.09 | 32.39 |
2022-03-31 | 541.579 | 54.362 | -37.325 |
2021-12-31 | 425.208 | 53.916 | -71.279 |
2021-09-30 | 389.798 | 40.596 | -34.476 |
2021-06-30 | 376.269 | 44.831 | -27.447 |
LNTH's Quality Factors
The “Quality” component of the POWR Ratings focuses on 31 different factors of a companies fundamentals and operational strength. Here are some key insights as we drill into the specifics of these quality attributes.- LNTH has a Quality Grade of C, ranking ahead of 29.96% of graded US stocks.
- LNTH's asset turnover comes in at 0.436 -- ranking 105th of 682 Pharmaceutical Products stocks.
- AVDL, OTIC, and SYRS are the stocks whose asset turnover ratios are most correlated with LNTH.
The table below shows LNTH's key quality metrics over time.
Period | Asset Turnover | Gross Margin | ROIC |
---|---|---|---|
2021-06-30 | 0.436 | 0.431 | -0.030 |
2021-03-31 | 0.393 | 0.416 | 0.016 |
2020-12-31 | 0.448 | 0.409 | -0.004 |
2020-09-30 | 0.521 | 0.432 | 0.006 |
2020-06-30 | 0.634 | 0.452 | 0.034 |
2020-03-31 | 0.877 | 0.480 | 0.075 |
LNTH Price Target
For more insight on analysts targets of LNTH, see our LNTH price target page. And for a list of of all stocks sorted by upside potential based on analyst target price, see our Top Price Target page.
Average Price Target | $32.00 | Average Broker Recommendation | 1.17 (Strong Buy) |
Lantheus Holdings, Inc. (LNTH) Company Bio
Lantheus Holdings, Inc. develops, manufactures, and commercializes diagnostic medical imaging agents and products for the diagnosis and treatment of cardiovascular and other diseases worldwide. The company was founded in 1956 and is based in North Billerica, Massachusetts.
Latest LNTH News From Around the Web
Below are the latest news stories about LANTHEUS HOLDINGS INC that investors may wish to consider to help them evaluate LNTH as an investment opportunity.
Strength Seen in Lantheus Holdings (LNTH): Can Its 6.4% Jump Turn into More Strength?Lantheus Holdings (LNTH) saw its shares surge in the last session with trading volume being higher than average. The latest trend in earnings estimate revisions may not translate into further price increase in the near term. |
Here is What to Know Beyond Why Lantheus Holdings, Inc. (LNTH) is a Trending StockRecently, Zacks.com users have been paying close attention to Lantheus Holdings (LNTH). This makes it worthwhile to examine what the stock has in store. |
Lantheus Holdings (LNTH) Outpaces Stock Market Gains: What You Should KnowLantheus Holdings (LNTH) closed at $66.40 in the latest trading session, marking a +0.36% move from the prior day. |
Wall Street Analysts Think Lantheus Holdings (LNTH) Is a Good Investment: Is It?According to the average brokerage recommendation (ABR), one should invest in Lantheus Holdings (LNTH). It is debatable whether this highly sought-after metric is effective because Wall Street analysts' recommendations tend to be overly optimistic. Would it be worth investing in the stock? |
Lantheus Announces Top Rated Oral Presentation Featuring PYLARIFY AI™ at the 2023 European Association of Nuclear Medicine (EANM) Annual MeetingBEDFORD, Mass., Sept. 01, 2023 (GLOBE NEWSWIRE) -- Lantheus Holdings, Inc. (the Company) (NASDAQ: LNTH), a company committed to improving patient outcomes through diagnostics, radiotherapeutics and artificial intelligence solutions that enable clinicians to Find, Fight and Follow disease, announced PYLARIFY AI data will be presented at the upcoming 2023 European Association of Nuclear Medicine (EANM) Annual Meeting, which will be held September 9-13, 2023 in Vienna, Austria. PYLARIFY AI™ (aPROMI |
LNTH Price Returns
1-mo | -10.35% |
3-mo | -34.74% |
6-mo | -25.85% |
1-year | -17.51% |
3-year | 384.20% |
5-year | 285.81% |
YTD | 18.49% |
2022 | 76.39% |
2021 | 114.16% |
2020 | -34.23% |
2019 | 31.05% |
2018 | -23.47% |
Continue Researching LNTH
Here are a few links from around the web to help you further your research on Lantheus Holdings Inc's stock as an investment opportunity:Lantheus Holdings Inc (LNTH) Stock Price | Nasdaq
Lantheus Holdings Inc (LNTH) Stock Quote, History and News - Yahoo Finance
Lantheus Holdings Inc (LNTH) Stock Price and Basic Information | MarketWatch
Loading social stream, please wait...