
Open Lending Corp. Cl A (LPRO): Price and Financial Metrics
LPRO Price/Volume Stats
| Current price | $6.34 | 52-week high | $11.49 |
| Prev. close | $6.14 | 52-week low | $4.57 |
| Day low | $6.16 | Volume | 522,900 |
| Day high | $6.38 | Avg. volume | 461,299 |
| 50-day MA | $6.11 | Dividend yield | N/A |
| 200-day MA | $6.53 | Market Cap | 755.51M |
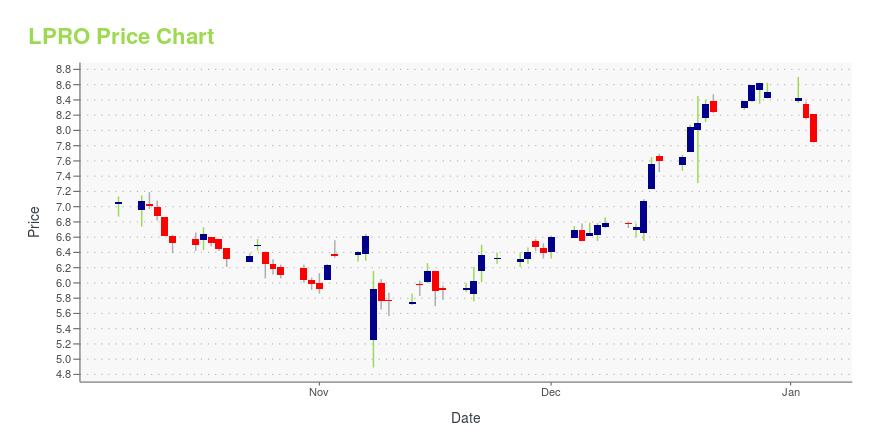
LPRO Stock Price Chart Interactive Chart >
Open Lending Corp. Cl A (LPRO) Company Bio
Open Lending Corp. provides automated lending services to financial institutions. It specializes in loan analytics, risk-based pricing, risk modeling and automated decision technology for automotive lenders throughout the United States. The company was founded by Sandy Watkins in 2000 and is headquartered in Austin, TX.
Latest LPRO News From Around the Web
Below are the latest news stories about OPEN LENDING CORP that investors may wish to consider to help them evaluate LPRO as an investment opportunity.
Open Lending Publishes Inaugural ESG ReportLending enablement provider shares data and insights on the fulfillment of its mission to change lives by making transportation more affordableAUSTIN, Texas, Dec. 20, 2023 (GLOBE NEWSWIRE) -- Open Lending Corporation (Nasdaq: LPRO) (“Open Lending” or the “Company”), an industry trailblazer in automotive lending enablement and risk analytics solutions for financial institutions, today announced the publication of its inaugural Environmental, Social, and Governance Report (the “ESG Report”). The E |
There's Reason For Concern Over Open Lending Corporation's (NASDAQ:LPRO) Massive 29% Price JumpOpen Lending Corporation ( NASDAQ:LPRO ) shareholders would be excited to see that the share price has had a great... |
Near- and Non-Prime Consumers Face Shrinking Access to Automotive Financing in 2023, Open Lending Research FindsAUSTIN, Texas, December 13, 2023--Open Lending Corporation (NASDAQ: LPRO) ("Open Lending" or the "Company"), an industry trailblazer in automotive lending enablement and risk analytics solutions for financial institutions, today released its first Near- and Non-Prime Consumer Update, a quarterly proprietary data report on automotive lending trends in the near- and non-prime credit segments. |
Open Lending (NASDAQ:LPRO) shareholders have endured a 78% loss from investing in the stock three years agoIt's not possible to invest over long periods without making some bad investments. But you want to avoid the really big... |
Open Lending Named Winner of 2023 NAFCU Innovation AwardAUSTIN, Texas, December 04, 2023--Open Lending Corporation (NASDAQ: LPRO) ("Open Lending" or "the Company"), an industry trailblazer in automotive lending enablement and risk analytics solutions for financial institutions, has been selected as a winner of the 2023 NAFCU Innovation Award for its enhanced Lenders Protection™ scorecard. The awards program recognizes companies making the most valuable and innovative contributions to credit union success, including groundbreaking advancements in tech |
LPRO Price Returns
| 1-mo | 15.69% |
| 3-mo | 27.82% |
| 6-mo | -15.01% |
| 1-year | -43.39% |
| 3-year | -82.47% |
| 5-year | N/A |
| YTD | -25.50% |
| 2023 | 26.07% |
| 2022 | -69.97% |
| 2021 | -35.70% |
| 2020 | N/A |
| 2019 | N/A |
Loading social stream, please wait...