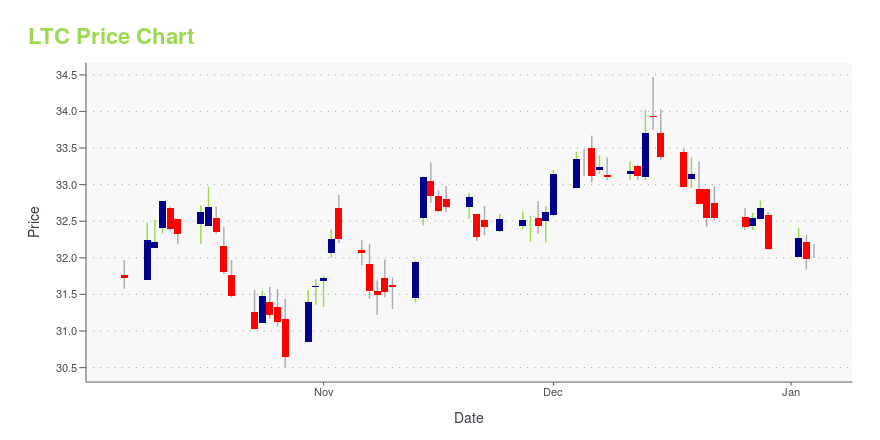
LTC Properties, Inc. (LTC): Price and Financial Metrics
GET POWR RATINGS... FREE!
LTC POWR Grades
- Quality is the dimension where LTC ranks best; there it ranks ahead of 67.91% of US stocks.
- The strongest trend for LTC is in Sentiment, which has been heading down over the past 178 days.
- LTC ranks lowest in Value; there it ranks in the 29th percentile.
LTC Stock Summary
- Of note is the ratio of LTC PROPERTIES INC's sales and general administrative expense to its total operating expenses; merely 13.59% of US stocks have a lower such ratio.
- For LTC, its debt to operating expenses ratio is greater than that reported by 91.53% of US equities we're observing.
- With a price/sales ratio of 7.84, LTC PROPERTIES INC has a higher such ratio than 85.82% of stocks in our set.
- Stocks with similar financial metrics, market capitalization, and price volatility to LTC PROPERTIES INC are UBA, CTRE, UMH, ESBA, and NHI.
- LTC's SEC filings can be seen here. And to visit LTC PROPERTIES INC's official web site, go to www.LTCreit.com.
LTC Valuation Summary
- In comparison to the median Real Estate stock, LTC's price/sales ratio is 86.05% higher, now standing at 8.
- Over the past 243 months, LTC's price/sales ratio has gone up 6.2.
Below are key valuation metrics over time for LTC.
Stock | Date | P/S | P/B | P/E | EV/EBIT |
---|---|---|---|---|---|
LTC | 2023-03-10 | 8.0 | 1.7 | 14.1 | 16.4 |
LTC | 2023-03-09 | 8.2 | 1.7 | 14.4 | 16.7 |
LTC | 2023-03-08 | 8.3 | 1.8 | 14.6 | 16.8 |
LTC | 2023-03-07 | 8.2 | 1.7 | 14.5 | 16.7 |
LTC | 2023-03-06 | 8.3 | 1.7 | 14.5 | 16.8 |
LTC | 2023-03-03 | 8.4 | 1.8 | 14.7 | 16.9 |
LTC Growth Metrics
- Its 3 year net cashflow from operations growth rate is now at -26.7%.
- The 5 year cash and equivalents growth rate now stands at 253.73%.
- Its 4 year net cashflow from operations growth rate is now at 11.56%.

The table below shows LTC's growth in key financial areas (numbers in millions of US dollars).
Date | Revenue | Operating Cash Flow | Net Income to Common Stock |
---|---|---|---|
2022-12-31 | 175.153 | 105.586 | 99.444 |
2022-09-30 | 166.755 | 94.375 | 94.225 |
2022-06-30 | 160.724 | 90.984 | 91.975 |
2022-03-31 | 155.829 | 88.493 | 56.036 |
2021-12-31 | 155.322 | 91.184 | 55.403 |
2021-09-30 | 162.154 | 100.053 | 60.167 |
LTC's Quality Factors
The “Quality” component of the POWR Ratings focuses on 31 different factors of a companies fundamentals and operational strength. Here are some key insights as we drill into the specifics of these quality attributes.- LTC has a Quality Grade of B, ranking ahead of 80.44% of graded US stocks.
- LTC's asset turnover comes in at 0.112 -- ranking 179th of 442 Trading stocks.
- GAIN, ALX, and VIRT are the stocks whose asset turnover ratios are most correlated with LTC.
The table below shows LTC's key quality metrics over time.
Period | Asset Turnover | Gross Margin | ROIC |
---|---|---|---|
2021-09-30 | 0.112 | 1 | 0.042 |
2021-06-30 | 0.112 | 1 | 0.043 |
2021-03-31 | 0.104 | 1 | 0.035 |
2020-12-31 | 0.107 | 1 | 0.058 |
2020-09-30 | 0.106 | 1 | 0.056 |
2020-06-30 | 0.111 | 1 | 0.062 |
LTC Price Target
For more insight on analysts targets of LTC, see our LTC price target page. And for a list of of all stocks sorted by upside potential based on analyst target price, see our Top Price Target page.
Average Price Target | $37.86 | Average Broker Recommendation | 2.12 (Hold) |
LTC Stock Price Chart Interactive Chart >
LTC Price/Volume Stats
Current price | $33.59 | 52-week high | $45.49 |
Prev. close | $33.74 | 52-week low | $32.23 |
Day low | $33.39 | Volume | 261,600 |
Day high | $34.22 | Avg. volume | 310,369 |
50-day MA | $36.38 | Dividend yield | 6.87% |
200-day MA | $38.74 | Market Cap | 1.39B |
LTC Properties, Inc. (LTC) Company Bio
LTC Properties, Inc. operates as a health care real estate investment trust (REIT) in the United States. It invests in senior housing and long term healthcare properties. The company was founded in 1992 and is based in Westlake Village, California.
Latest LTC News From Around the Web
Below are the latest news stories about LTC PROPERTIES INC that investors may wish to consider to help them evaluate LTC as an investment opportunity.
13 Best Monthly Dividend Stocks to Buy According to AnalystsIn this article, we discuss 13 best monthly dividend stocks to buy according to analysts. You can skip our detailed analysis of dividend stocks and their performance, and go directly to read 5 Best Monthly Dividend Stocks to Buy According to Analysts. In 2022, dividends remained a bright spot for investors, despite a stock market […] |
Those who invested in LTC Properties (NYSE:LTC) three years ago are up 48%Buying a low-cost index fund will get you the average market return. But if you invest in individual stocks, some are... |
LTC Publishes Inaugural Environmental, Social and Governance (ESG) ReportWESTLAKE VILLAGE, Calif., March 16, 2023--LTC Properties, Inc. (NYSE: LTC), a real estate investment trust that primarily invests in seniors housing and health care properties, today announced the publication of its inaugural Environmental, Social and Governance (ESG) report titled, "People. Planet. Purpose." The report shares information about LTC’s activities and future goals, highlighting the Company’s key achievements, policies and performance. |
Analysts Just Gave These REITs Strong Upside Price BumpsWall Street analysts sometimes see room for improvement in the price targets of certain stocks, which can be an opportunity for investors to quickly pick up shares that have the potential for strong appreciation. For dividend stocks such as real estate investment trusts (REITs), this is sometimes an opportunity to acquire a REIT while the yield is high as well. Here are four REITs whose recent prices are well below recent analyst price target increases, offering a potential opportunity for stron |
7 Cryptos to Watch as Fed Decision Time LoomsWith the banking sector suffering two major failures, blockchain investors may face a make-or-break moment in cryptos. |
LTC Price Returns
1-mo | N/A |
3-mo | -5.20% |
6-mo | -10.04% |
1-year | -3.31% |
3-year | 46.80% |
5-year | 22.06% |
YTD | -3.95% |
2022 | 10.52% |
2021 | -6.77% |
2020 | -7.56% |
2019 | 12.36% |
2018 | 1.12% |
LTC Dividends
Ex-Dividend Date | Type | Payout Amount | Change | ||||||
---|---|---|---|---|---|---|---|---|---|
Loading, please wait... |
Continue Researching LTC
Want to do more research on Ltc Properties Inc's stock and its price? Try the links below:Ltc Properties Inc (LTC) Stock Price | Nasdaq
Ltc Properties Inc (LTC) Stock Quote, History and News - Yahoo Finance
Ltc Properties Inc (LTC) Stock Price and Basic Information | MarketWatch
Loading social stream, please wait...