LSB Industries, Inc. (LXU): Price and Financial Metrics
GET POWR RATINGS... FREE!
LXU POWR Grades
- Sentiment is the dimension where LXU ranks best; there it ranks ahead of 99.94% of US stocks.
- The strongest trend for LXU is in Value, which has been heading down over the past 179 days.
- LXU's current lowest rank is in the Value metric (where it is better than 17.45% of US stocks).
LXU Stock Summary
- LXU's one year PEG ratio, measuring expected growth in earnings next year relative to current common stock price is 1.28 -- higher than just 6.44% of US-listed equities with positive expected earnings growth.
- The ratio of debt to operating expenses for Lsb Industries Inc is higher than it is for about 94.71% of US stocks.
- Over the past twelve months, LXU has reported earnings growth of -668.46%, putting it ahead of merely 3.19% of US stocks in our set.
- If you're looking for stocks that are quantitatively similar to Lsb Industries Inc, a group of peers worth examining would be PBF, AMTX, TRN, HTGC, and VGR.
- Visit LXU's SEC page to see the company's official filings. To visit the company's web site, go to www.lsbindustries.com.
LXU Valuation Summary
- In comparison to the median Basic Materials stock, LXU's price/sales ratio is 62.5% lower, now standing at 0.6.
- Over the past 243 months, LXU's price/earnings ratio has gone up 8.
- Over the past 243 months, LXU's price/sales ratio has gone up 0.5.
Below are key valuation metrics over time for LXU.
Stock | Date | P/S | P/B | P/E | EV/EBIT |
---|---|---|---|---|---|
LXU | 2021-09-03 | 0.6 | 1.8 | -3.5 | 49.2 |
LXU | 2021-09-02 | 0.6 | 1.8 | -3.5 | 49.2 |
LXU | 2021-09-01 | 0.6 | 1.8 | -3.4 | 49.0 |
LXU | 2021-08-31 | 0.6 | 1.8 | -3.5 | 49.1 |
LXU | 2021-08-30 | 0.6 | 1.7 | -3.4 | 48.9 |
LXU | 2021-08-27 | 0.6 | 1.8 | -3.5 | 49.3 |
LXU Growth Metrics
- Its 5 year net income to common stockholders growth rate is now at -52.78%.
- The 5 year net cashflow from operations growth rate now stands at -121.71%.
- Its year over year cash and equivalents growth rate is now at -62.03%.

The table below shows LXU's growth in key financial areas (numbers in millions of US dollars).
Date | Revenue | Operating Cash Flow | Net Income to Common Stock |
---|---|---|---|
2021-12-31 | 556.239 | 87.627 | -220.002 |
2021-09-30 | 454.914 | 38.243 | -293.807 |
2021-06-30 | 401.684 | 8.692 | -72.177 |
2021-03-31 | 366.021 | 12.376 | -94.457 |
2020-12-31 | 351.316 | -2.513 | -99.419 |
2020-09-30 | 336.309 | -14.158 | -104.257 |
LXU's Quality Factors
The “Quality” component of the POWR Ratings focuses on 31 different factors of a companies fundamentals and operational strength. Here are some key insights as we drill into the specifics of these quality attributes.- LXU has a Quality Grade of D, ranking ahead of 13.48% of graded US stocks.
- LXU's asset turnover comes in at 0.38 -- ranking 67th of 89 Chemicals stocks.
- FUL, REX, and OLN are the stocks whose asset turnover ratios are most correlated with LXU.
The table below shows LXU's key quality metrics over time.
Period | Asset Turnover | Gross Margin | ROIC |
---|---|---|---|
2021-06-30 | 0.380 | 0.096 | 0.010 |
2021-03-31 | 0.343 | 0.062 | -0.007 |
2020-12-31 | 0.325 | 0.049 | -0.011 |
2020-09-30 | 0.308 | 0.024 | -0.024 |
2020-06-30 | 0.306 | -0.001 | -0.031 |
2020-03-31 | 0.317 | 0.001 | -0.030 |
LXU Price Target
For more insight on analysts targets of LXU, see our LXU price target page. And for a list of of all stocks sorted by upside potential based on analyst target price, see our Top Price Target page.
Average Price Target | $10.25 | Average Broker Recommendation | 1.5 (Moderate Buy) |
LXU Stock Price Chart Interactive Chart >
LXU Price/Volume Stats
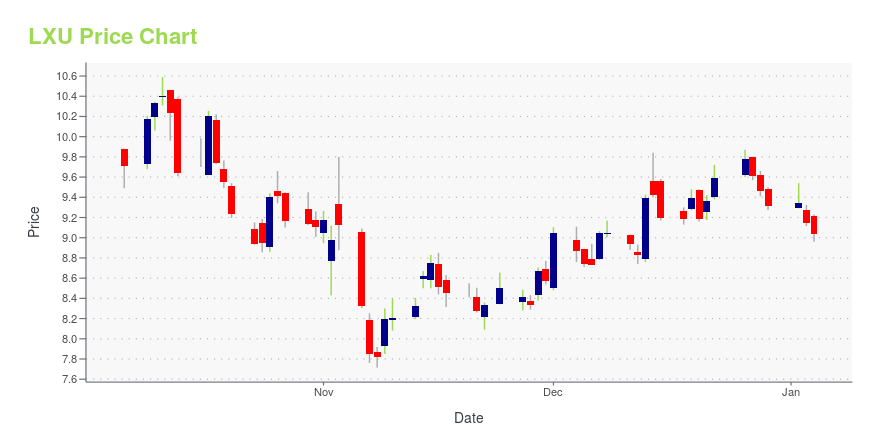
Current price | $21.90 | 52-week high | $27.45 |
Prev. close | $19.84 | 52-week low | $3.59 |
Day low | $20.76 | Volume | 742,333 |
Day high | $21.96 | Avg. volume | 714,836 |
50-day MA | $21.84 | Dividend yield | N/A |
200-day MA | $12.57 | Market Cap | 1.96B |
LSB Industries, Inc. (LXU) Company Bio
LSB Industries is a manufacturing and marketing company. LSB's principal business activities consist of the manufacture and sale of chemical products for the agricultural, mining, and industrial markets and the manufacture and sale of commercial and residential climate control products, such as water source and geothermal heat pumps, hydronic fan coils, modular geothermal chillers, and large custom air handlers. The company was founded in 1968 and is based in Oklahoma City, Oklahoma.
Latest LXU News From Around the Web
Below are the latest news stories about Lsb Industries Inc that investors may wish to consider to help them evaluate LXU as an investment opportunity.
LSB Industries posts easy Q4 earnings beat, sees strong demand for ag productsLSB Industries (NYSE:LXU) +3.5% post-market after easily beating Q4 adjusted earnings estimates and saying it expects demand for agricultural products will "remain robust in 2022 after a very strong 2021." The producer of ag chemicals said it achieves the all-time highest quarterly and full-year adjusted EBITDA in the company's history, $90.1M and... |
LSB Industries posts easy Q4 earnings beat, sees strong demand for ag products (NYSE:LXU)LSBIndustries (LXU)+3.5% post-market after easily beating Q4 adjusted earnings estimates and saying it expects demand for agricultural products will "remain robust in 2022 after a… |
LSB Industries Non-GAAP EPS of $0.72 beats by $0.35, revenue of $190.2M misses by $10.03M (NYSE:LXU)LSB Industries press release (LXU): Q4 Non-GAAP EPS of $0.72 beats by $0.35.Revenue of $190.2M (+113.9% Y/Y) misses by $10.03M. |
LSB Industries, Inc. Reports Record Operating Results for the 2021 Fourth Quarter and Full YearOKLAHOMA CITY--(BUSINESS WIRE)--LSB Industries, Inc. (NYSE: LXU) (“LSB” or the “Company”) today announced results for the fourth quarter ended December 31, 2021. Fourth Quarter 2021 Highlights Net sales of $190.2 million compared to $88.9 million in the fourth quarter of 2020 Adjusted EBITDA(1)of $90.1 million compared to $10.4 million in the fourth quarter of 2020 Adjusted EBITDA(1) margin of 47.4% compared to 11.7% in the fourth quarter of 2020 Adjusted EPS(1) of $0.72 in the fourth quarter o |
Analysts Are Optimistic We'll See A Profit From LSB Industries, Inc. (NYSE:LXU)LSB Industries, Inc. ( NYSE:LXU ) is possibly approaching a major achievement in its business, so we would like to... |
LXU Price Returns
1-mo | N/A |
3-mo | 78.34% |
6-mo | 116.19% |
1-year | 330.71% |
3-year | 521.61% |
5-year | 240.14% |
YTD | 98.19% |
2021 | 323.75% |
2020 | -19.29% |
2019 | -23.91% |
2018 | -36.99% |
2017 | 4.04% |
Continue Researching LXU
Here are a few links from around the web to help you further your research on Lsb Industries Inc's stock as an investment opportunity:Lsb Industries Inc (LXU) Stock Price | Nasdaq
Lsb Industries Inc (LXU) Stock Quote, History and News - Yahoo Finance
Lsb Industries Inc (LXU) Stock Price and Basic Information | MarketWatch
Loading social stream, please wait...