
Mid-America Apartment Communities Inc. (MAA): Price and Financial Metrics
MAA Price/Volume Stats
| Current price | $149.85 | 52-week high | $173.38 |
| Prev. close | $151.45 | 52-week low | $136.85 |
| Day low | $148.93 | Volume | 862,700 |
| Day high | $151.17 | Avg. volume | 884,419 |
| 50-day MA | $157.09 | Dividend yield | 4.03% |
| 200-day MA | $157.88 | Market Cap | 17.54B |
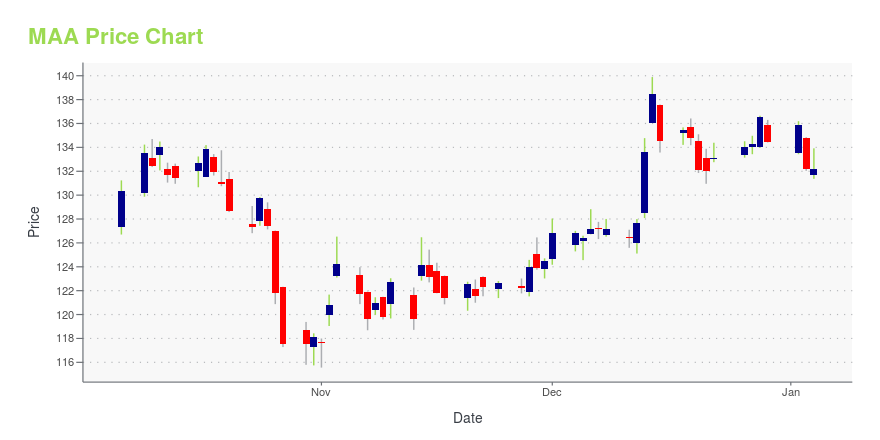
MAA Stock Price Chart Interactive Chart >
Mid-America Apartment Communities Inc. (MAA) Company Bio
Mid-America Apartment Communities (MAA) is a publicly traded real estate investment trust based in Memphis, Tennessee that invests in apartments in the Southeastern United States and the Southwestern United States. (Source:Wikipedia)
MAA Price Returns
| 1-mo | -6.87% |
| 3-mo | -7.36% |
| 6-mo | -3.61% |
| 1-year | 11.92% |
| 3-year | 3.60% |
| 5-year | 50.38% |
| YTD | -1.13% |
| 2024 | 19.94% |
| 2023 | -11.07% |
| 2022 | -29.75% |
| 2021 | 85.87% |
| 2020 | -0.64% |
MAA Dividends
| Ex-Dividend Date | Type | Payout Amount | Change | ||||||
|---|---|---|---|---|---|---|---|---|---|
| Loading, please wait... | |||||||||
Continue Researching MAA
Want to do more research on Mid America Apartment Communities Inc's stock and its price? Try the links below:Mid America Apartment Communities Inc (MAA) Stock Price | Nasdaq
Mid America Apartment Communities Inc (MAA) Stock Quote, History and News - Yahoo Finance
Mid America Apartment Communities Inc (MAA) Stock Price and Basic Information | MarketWatch
Loading social stream, please wait...