
Mid-America Apartment Communities Inc. (MAA): Price and Financial Metrics
MAA Price/Volume Stats
| Current price | $142.50 | 52-week high | $153.29 |
| Prev. close | $140.12 | 52-week low | $115.56 |
| Day low | $140.13 | Volume | 496,700 |
| Day high | $143.41 | Avg. volume | 771,259 |
| 50-day MA | $138.81 | Dividend yield | 4.09% |
| 200-day MA | $131.40 | Market Cap | 16.65B |
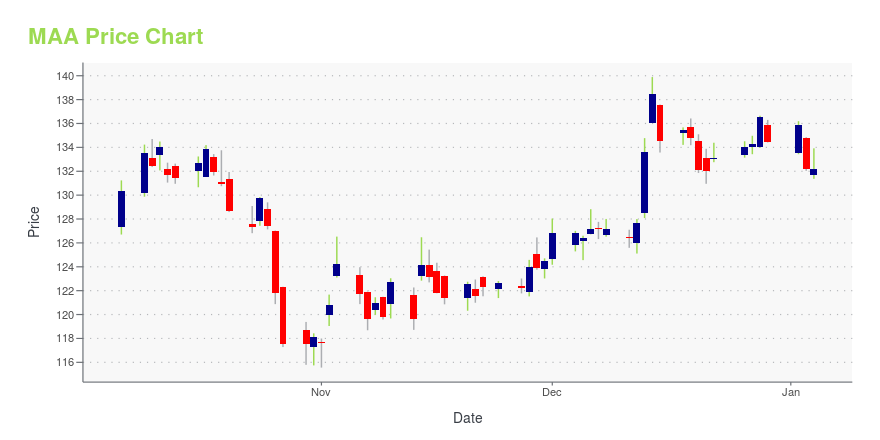
MAA Stock Price Chart Interactive Chart >
Mid-America Apartment Communities Inc. (MAA) Company Bio
Mid-America Apartment Communities (MAA) is a publicly traded real estate investment trust based in Memphis, Tennessee that invests in apartments in the Southeastern United States and the Southwestern United States. (Source:Wikipedia)
Latest MAA News From Around the Web
Below are the latest news stories about MID AMERICA APARTMENT COMMUNITIES INC that investors may wish to consider to help them evaluate MAA as an investment opportunity.
Bull Market Buys: 3 Dividend Stocks to Own for the Long RunThese dividend stocks could start their own bull run in 2024 as their headwind fades. |
This Pennsylvania trio bought a $100K abandoned school and transformed it into a 31-unit apartment building — here's how to invest in residential real estate without the heavy liftingThe name of the game is passive income. |
Want To Defeat Inflation? Three REITs That Keep Raising DividendsAlthough recent consumer price index (CPI) reports have signified that inflation levels are slowly declining from the much higher percentages of the past two years, inflation remains a problem for many Americans, especially those on fixed incomes in retirement. But many retirees or those nearing retirement age benefit from investing in dividend stocks, such as real estate investment trusts (REITs), because the monthly or quarterly payments help them in paying ongoing expenses. And unlike a CD, h |
3 of the Most Attractive Dividend Stocks in the REITs SpaceInvestors looking for top REITs to invest in should focus on these stocks that provide strong growth opportunities and attractive dividends. |
MAA Appoints Brad Hill to President and Chief Investment OfficerMid-America Apartment Communities, Inc., ("MAA") (NYSE: MAA) a leading multifamily real estate investment trust, announced today that A. Bradley Hill, 47, has been promoted to the role of President and Chief Investment Officer. In this expanded role, Mr. Hill will continue his oversight of the company's development, acquisition, and disposition activities, while also assuming responsibility for asset management, property management and information technology operations. |
MAA Price Returns
| 1-mo | 3.49% |
| 3-mo | 11.43% |
| 6-mo | 11.30% |
| 1-year | -0.43% |
| 3-year | -16.15% |
| 5-year | 41.34% |
| YTD | 9.52% |
| 2023 | -11.07% |
| 2022 | -29.75% |
| 2021 | 85.87% |
| 2020 | -0.64% |
| 2019 | 42.52% |
MAA Dividends
| Ex-Dividend Date | Type | Payout Amount | Change | ||||||
|---|---|---|---|---|---|---|---|---|---|
| Loading, please wait... | |||||||||
Continue Researching MAA
Want to do more research on Mid America Apartment Communities Inc's stock and its price? Try the links below:Mid America Apartment Communities Inc (MAA) Stock Price | Nasdaq
Mid America Apartment Communities Inc (MAA) Stock Quote, History and News - Yahoo Finance
Mid America Apartment Communities Inc (MAA) Stock Price and Basic Information | MarketWatch
Loading social stream, please wait...