Manhattan Associates, Inc. (MANH): Price and Financial Metrics
MANH Price/Volume Stats
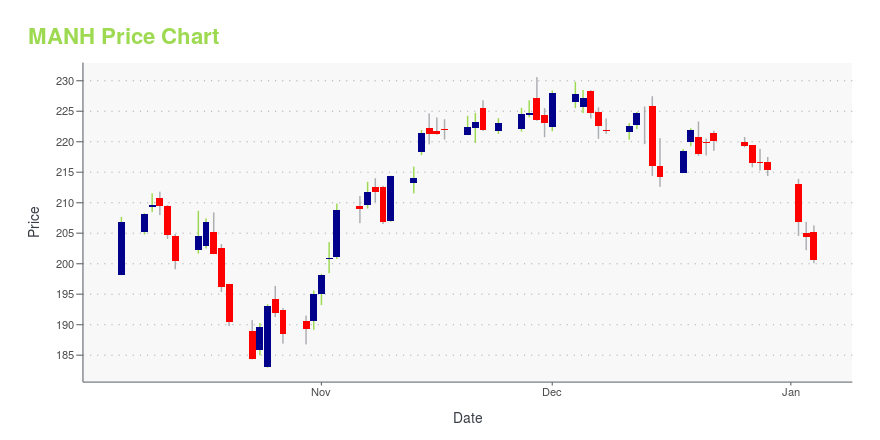
Current price | $194.45 | 52-week high | $208.31 |
Prev. close | $193.17 | 52-week low | $107.18 |
Day low | $192.28 | Volume | 454,300 |
Day high | $195.70 | Avg. volume | 361,560 |
50-day MA | $194.97 | Dividend yield | N/A |
200-day MA | $163.90 | Market Cap | 11.99B |
MANH Stock Price Chart Interactive Chart >
MANH POWR Grades
- MANH scores best on the Quality dimension, with a Quality rank ahead of 98.04% of US stocks.
- MANH's strongest trending metric is Stability; it's been moving down over the last 179 days.
- MANH's current lowest rank is in the Value metric (where it is better than 12.55% of US stocks).
MANH Stock Summary
- With a price/earnings ratio of 85.33, MANHATTAN ASSOCIATES INC P/E ratio is greater than that of about 93.74% of stocks in our set with positive earnings.
- The price/operating cash flow metric for MANHATTAN ASSOCIATES INC is higher than 95.1% of stocks in our set with a positive cash flow.
- MANH's price/sales ratio is 14.68; that's higher than the P/S ratio of 92.86% of US stocks.
- Stocks that are quantitatively similar to MANH, based on their financial statements, market capitalization, and price volatility, are DUOL, PINS, FROG, QLYS, and CHPT.
- Visit MANH's SEC page to see the company's official filings. To visit the company's web site, go to www.manh.com.
MANH Valuation Summary
- MANH's price/sales ratio is 14.5; this is 437.04% higher than that of the median Technology stock.
- MANH's EV/EBIT ratio has moved up 45.9 over the prior 243 months.
Below are key valuation metrics over time for MANH.
Stock | Date | P/S | P/B | P/E | EV/EBIT |
---|---|---|---|---|---|
MANH | 2023-09-15 | 14.5 | 71.9 | 84.0 | 66.4 |
MANH | 2023-09-14 | 14.7 | 73.4 | 85.7 | 67.7 |
MANH | 2023-09-13 | 14.5 | 72.2 | 84.4 | 66.6 |
MANH | 2023-09-12 | 14.5 | 72.0 | 84.1 | 66.5 |
MANH | 2023-09-11 | 14.8 | 73.4 | 85.8 | 67.8 |
MANH | 2023-09-08 | 14.6 | 72.5 | 84.7 | 66.9 |
MANH Growth Metrics
- Its 4 year net cashflow from operations growth rate is now at -23.03%.
- Its 3 year revenue growth rate is now at 18.85%.
- Its 3 year price growth rate is now at 102.34%.

The table below shows MANH's growth in key financial areas (numbers in millions of US dollars).
Date | Revenue | Operating Cash Flow | Net Income to Common Stock |
---|---|---|---|
2022-12-31 | 767.084 | 179.63 | 128.959 |
2022-09-30 | 740.475 | 164.505 | 111.673 |
2022-06-30 | 711.559 | 184.27 | 118.653 |
2022-03-31 | 685.749 | 177.09 | 118.421 |
2021-12-31 | 663.643 | 185.183 | 110.472 |
2021-09-30 | 639.231 | 183.097 | 110.43 |
MANH's Quality Factors
The “Quality” component of the POWR Ratings focuses on 31 different factors of a companies fundamentals and operational strength. Here are some key insights as we drill into the specifics of these quality attributes.- MANH has a Quality Grade of A, ranking ahead of 99.54% of graded US stocks.
- MANH's asset turnover comes in at 1.336 -- ranking 67th of 563 Business Services stocks.
- VRNS, GRPN, and TZOO are the stocks whose asset turnover ratios are most correlated with MANH.
The table below shows MANH's key quality metrics over time.
Period | Asset Turnover | Gross Margin | ROIC |
---|---|---|---|
2021-09-30 | 1.336 | 0.557 | 9.631 |
2021-06-30 | 1.365 | 0.554 | 5.598 |
2021-03-31 | 1.369 | 0.543 | 3.829 |
2020-12-31 | 1.456 | 0.540 | 2.770 |
2020-09-30 | 1.561 | 0.536 | 2.400 |
2020-06-30 | 1.633 | 0.530 | 2.149 |
MANH Price Target
For more insight on analysts targets of MANH, see our MANH price target page. And for a list of of all stocks sorted by upside potential based on analyst target price, see our Top Price Target page.
Average Price Target | $182.00 | Average Broker Recommendation | 1.58 (Moderate Buy) |
Manhattan Associates, Inc. (MANH) Company Bio
Manhattan Associates develops, sells, deploys, services, and maintains software solutions to manage supply chains, inventory, and omni-channel operations for retailers, wholesalers, manufacturers, logistics providers, and other organizations. The company was founded in 1990 and is based in Atlanta, Georgia.
Latest MANH News From Around the Web
Below are the latest news stories about MANHATTAN ASSOCIATES INC that investors may wish to consider to help them evaluate MANH as an investment opportunity.
Duluth Trading Company Implements Manhattan Active® Warehouse Management at New State-of-the-Art Georgia Distribution CenterATLANTA, September 18, 2023--Manhattan Associates Inc. (NASDAQ: MANH) today announced that Duluth Trading Company, a renowned casualwear, workwear and accessory retailer for men and women, has successfully implemented Manhattan Active® Warehouse Management at its new distribution and fulfillment facility in Adairsville, Georgia. Officially open today, this highly automated facility will help Duluth Trading better serve its 65 retail stores and growing ecommerce business. |
These 5 Real Market Leaders Are Near Buy PointsS&P 500 giants Amazon, Netflix and ServiceNow boast relative strength lines at new highs while still in bases, earning a coveted "blue dot." |
Why Manhattan Associates Is Guarded On Generative AI Amid Shift To CloudManhattan Associates, a maker of supply-chain software, has soared 66% in 2023 as its transition to software as a service gains momentum. |
Manhattan Associates Transforms Retail ReturnsATLANTA, September 05, 2023--Manhattan Associates Inc. (NASDAQ: MANH) has announced enhanced Returns Management capabilities to streamline and optimize the returns process, and deliver a frictionless experience for both consumers and retailers. The new returns features strengthen customer loyalty by creating a frictionless experience, promoting an increase in store traffic and cross-selling opportunities. |
Is Manhattan Associates, Inc. (NASDAQ:MANH) Potentially Undervalued?Let's talk about the popular Manhattan Associates, Inc. ( NASDAQ:MANH ). The company's shares saw a double-digit share... |
MANH Price Returns
1-mo | 2.37% |
3-mo | 3.47% |
6-mo | 31.13% |
1-year | 50.00% |
3-year | 107.13% |
5-year | 245.01% |
YTD | 60.17% |
2022 | -21.92% |
2021 | 47.83% |
2020 | 31.89% |
2019 | 88.22% |
2018 | -14.47% |
Continue Researching MANH
Want to see what other sources are saying about Manhattan Associates Inc's financials and stock price? Try the links below:Manhattan Associates Inc (MANH) Stock Price | Nasdaq
Manhattan Associates Inc (MANH) Stock Quote, History and News - Yahoo Finance
Manhattan Associates Inc (MANH) Stock Price and Basic Information | MarketWatch
Loading social stream, please wait...