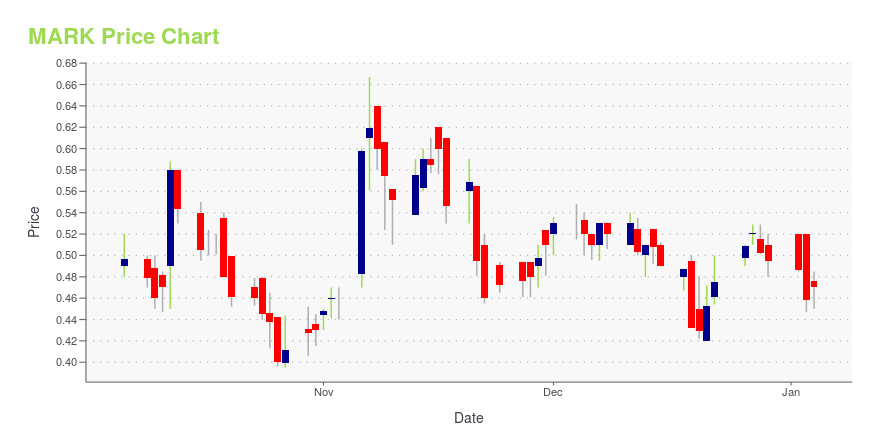
Remark Holdings, Inc. (MARK): Price and Financial Metrics
MARK Price/Volume Stats
| Current price | $0.11 | 52-week high | $1.49 |
| Prev. close | $0.11 | 52-week low | $0.10 |
| Day low | $0.11 | Volume | 83,600 |
| Day high | $0.11 | Avg. volume | 4,273,293 |
| 50-day MA | $0.13 | Dividend yield | N/A |
| 200-day MA | $0.32 | Market Cap | 5.37M |
MARK Stock Price Chart Interactive Chart >
Remark Holdings, Inc. (MARK) Company Bio
Remark Holdings, Inc. owns, operates, and acquires digital media properties across multiple verticals that deliver content worldwide. The company leverages its digital media assets to target the Millennial demographic, which provides it with access to markets. The company was formerly known as HSW International, Inc. and changed its name to Remark Media, Inc. in January 2012. The company was founded in 2006 and is headquartered in Las Vegas, Nevada.
Latest MARK News From Around the Web
Below are the latest news stories about REMARK HOLDINGS INC that investors may wish to consider to help them evaluate MARK as an investment opportunity.
Remark Holdings Adjourns Annual Shareholder Meeting Until December 29, 2023Remark Holdings, Inc. (Nasdaq: MARK), a diversified global technology company with leading artificial intelligence ("AI") powered computer vision solutions, today announced the adjournment of its annual shareholder meeting until Friday, December 29, 2022 at 1:00 p.m. ET, to provide additional time to solicit votes to reach a quorum and conduct business. |
Remark Holdings, Inc. Releases Version 1.0 of its AI-powered Video Analytics System for Aircraft Engine Inspections And SafetyRemark Holdings, Inc. (Nasdaq: MARK), a diversified global technology company with leading artificial intelligence ("AI") powered computer vision solutions, today announced the release of version 1.0 of its Airline Engine Safety Inspection System (AESIS). Remark's AESIS is intended for use by airlines, airline maintenance teams, engine manufacturers, airplane manufacturers, aircraft leasing companies, insurance companies, regulators, etc. |
Remark Holdings, Inc. (NASDAQ:MARK) Q3 2023 Earnings Call TranscriptRemark Holdings, Inc. (NASDAQ:MARK) Q3 2023 Earnings Call Transcript November 20, 2023 Operator: Good day and welcome to the Remark Holdings Fiscal Third Quarter 2023 Financial Results Earnings Call. All participants will be in listen-only mode. [Operator Instructions] After today’s presentation, there will be an opportunity to ask questions. [Operator Instructions] Please note this event […] |
Q3 2023 Remark Holdings Inc Earnings CallQ3 2023 Remark Holdings Inc Earnings Call |
Remark Holdings Announces Third Quarter 2023 Financial ResultsRemark Holdings, Inc. (NASDAQ: MARK), a diversified global technology company with leading artificial intelligence ("AI") solutions and digital video analytics, today announced its financial results for its quarter ended September 30, 2023. For complete details of the consolidated financial statements and accompanying management's discussion and analysis, please see Remark's filings with the SEC (www.sec.gov). |
MARK Price Returns
| 1-mo | -9.84% |
| 3-mo | -20.58% |
| 6-mo | -69.02% |
| 1-year | -87.70% |
| 3-year | -99.15% |
| 5-year | -98.72% |
| YTD | -77.79% |
| 2023 | -54.98% |
| 2022 | -88.91% |
| 2021 | -47.82% |
| 2020 | 268.93% |
| 2019 | -57.44% |
Continue Researching MARK
Want to see what other sources are saying about Remark Holdings Inc's financials and stock price? Try the links below:Remark Holdings Inc (MARK) Stock Price | Nasdaq
Remark Holdings Inc (MARK) Stock Quote, History and News - Yahoo Finance
Remark Holdings Inc (MARK) Stock Price and Basic Information | MarketWatch


Loading social stream, please wait...