Masimo Corporation (MASI): Price and Financial Metrics
GET POWR RATINGS... FREE!
MASI POWR Grades
- Quality is the dimension where MASI ranks best; there it ranks ahead of 92.83% of US stocks.
- The strongest trend for MASI is in Growth, which has been heading up over the past 179 days.
- MASI's current lowest rank is in the Momentum metric (where it is better than 16.1% of US stocks).
MASI Stock Summary
- MASI's one year PEG ratio, measuring expected growth in earnings next year relative to current common stock price is 953.4 -- higher than 96.65% of US-listed equities with positive expected earnings growth.
- For MASI, its debt to operating expenses ratio is greater than that reported by merely 0.5% of US equities we're observing.
- Equity multiplier, or assets relative to shareholders' equity, comes in at 1.21 for Masimo Corp; that's greater than it is for only 13.3% of US stocks.
- Stocks with similar financial metrics, market capitalization, and price volatility to Masimo Corp are APPS, CPRX, BCOV, ICAD, and TTWO.
- Visit MASI's SEC page to see the company's official filings. To visit the company's web site, go to www.masimo.com.
MASI Valuation Summary
- In comparison to the median Healthcare stock, MASI's price/sales ratio is 234.21% higher, now standing at 12.7.
- MASI's price/sales ratio has moved up 8.1 over the prior 171 months.
Below are key valuation metrics over time for MASI.
Stock | Date | P/S | P/B | P/E | EV/EBIT |
---|---|---|---|---|---|
MASI | 2021-08-31 | 12.7 | 10.7 | 66.8 | 55.7 |
MASI | 2021-08-30 | 12.9 | 10.9 | 68.0 | 56.8 |
MASI | 2021-08-27 | 13.0 | 11.0 | 68.2 | 57.0 |
MASI | 2021-08-26 | 12.9 | 10.9 | 68.0 | 56.8 |
MASI | 2021-08-25 | 13.1 | 11.1 | 69.1 | 57.7 |
MASI | 2021-08-24 | 13.3 | 11.3 | 70.2 | 58.7 |
MASI Growth Metrics
- The 3 year net income to common stockholders growth rate now stands at 118.29%.
- Its 4 year cash and equivalents growth rate is now at 333.1%.
- Its 5 year cash and equivalents growth rate is now at 333.1%.

The table below shows MASI's growth in key financial areas (numbers in millions of US dollars).
Date | Revenue | Operating Cash Flow | Net Income to Common Stock |
---|---|---|---|
2021-12-31 | 1,239.153 | 264.754 | 229.647 |
2021-09-30 | 1,206.629 | 231.569 | 232.058 |
2021-06-30 | 1,177.327 | 190.161 | 223.692 |
2021-03-31 | 1,173.162 | 227.868 | 229.229 |
2020-12-31 | 1,143.744 | 210.963 | 240.302 |
2020-09-30 | 1,096.2 | 216.769 | 222.554 |
MASI's Quality Factors
The “Quality” component of the POWR Ratings focuses on 31 different factors of a companies fundamentals and operational strength. Here are some key insights as we drill into the specifics of these quality attributes.- MASI has a Quality Grade of B, ranking ahead of 88.45% of graded US stocks.
- MASI's asset turnover comes in at 0.714 -- ranking 51st of 186 Medical Equipment stocks.
- BLFS, NVNO, and ZYXI are the stocks whose asset turnover ratios are most correlated with MASI.
The table below shows MASI's key quality metrics over time.
Period | Asset Turnover | Gross Margin | ROIC |
---|---|---|---|
2021-10-02 | 0.714 | 0.647 | 0.384 |
2021-07-03 | 0.702 | 0.642 | 0.380 |
2021-04-03 | 0.705 | 0.643 | 0.387 |
2021-01-02 | 0.700 | 0.650 | 0.408 |
2020-09-26 | 0.705 | 0.660 | 0.413 |
2020-06-27 | 0.720 | 0.669 | 0.414 |
MASI Price Target
For more insight on analysts targets of MASI, see our MASI price target page. And for a list of of all stocks sorted by upside potential based on analyst target price, see our Top Price Target page.
Average Price Target | $298.80 | Average Broker Recommendation | 1.56 (Moderate Buy) |
MASI Stock Price Chart Interactive Chart >
MASI Price/Volume Stats
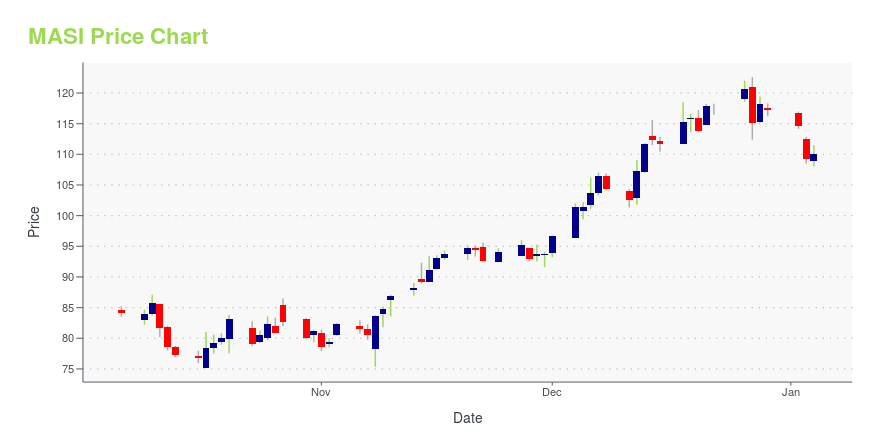
Current price | $143.50 | 52-week high | $305.21 |
Prev. close | $139.34 | 52-week low | $112.07 |
Day low | $140.15 | Volume | 950,700 |
Day high | $144.64 | Avg. volume | 972,023 |
50-day MA | $137.84 | Dividend yield | N/A |
200-day MA | $224.14 | Market Cap | 7.96B |
Masimo Corporation (MASI) Company Bio
Masimo Corporation develops, manufactures, and markets noninvasive monitoring technologies worldwide. The Company's core business is measure-through-motion and low-perfusion pulse oximetry monitoring, known as Masimo Signal Extraction Technology (SET) pulse oximetry. The company was founded in 1989 and is based in Irvine, California.
Latest MASI News From Around the Web
Below are the latest news stories about Masimo Corp that investors may wish to consider to help them evaluate MASI as an investment opportunity.
Needham Upgrades Masimo To Buy, With Price Target Of $205Needham has upgraded Masimo Corp (NASDAQ: MASI ) to Buy from Hold with a $205 price target . According to analyst Mike Matson, the selloff in the stock following the company''s Sound United acquisition was "overdone" as the deal should prove to be highly accretive to earnings. On 16 February, Masimo shares closed 37% lower at $144.62. Related: Masimo Stock … Full story available on Benzinga.com |
Masimo upgraded at Needham after concerns over acquisition triggered selloffAfter a loss of more than a third on Wednesday, Masimo < |
Masimo Corporation 2021 Q4 - Results - Earnings Call PresentationNo summary available. |
DEI Sales, Inc. -- Moody's says Sound United's B2 CFR and stable outlook unaffected by agreement to be acquired by MasimoAnnouncement: Moody's says Sound United's B2 CFR and stable outlook unaffected by agreement to be acquired by MasimoGlobal Credit Research - 17 Feb 2022New York, February 17, 2022 -- Moody's Investors Service ("Moody's") said that DEI Sales, Inc.'s (dba Sound United, B2, stable) announcement that it had entered into a definitive agreement to be acquired by Masimo Corporation ("Masimo", not rated), for a purchase price of approximately $1.025 billion. |
Masimo's (MASI) CEO Joe Kiani on Q4 2021 Results - Earnings Call TranscriptMasimo Corporation (MASI) Q4 2021 Earnings Conference Call February 15, 2022 4:30 PM ET Company Participants Eli Kammerman – Vice President-Business Development and Investor Relations Joe Kiani – Chairman and Chief Executive Officer Micah Young – Executive Vice President and Chief Financial Officer Conference Call Participants Matt Taylor – UBS... |
MASI Price Returns
1-mo | 27.02% |
3-mo | -8.86% |
6-mo | -48.40% |
1-year | -33.44% |
3-year | 4.02% |
5-year | 64.92% |
YTD | -50.99% |
2021 | 9.09% |
2020 | 69.80% |
2019 | 47.21% |
2018 | 26.62% |
2017 | 25.82% |
Continue Researching MASI
Want to see what other sources are saying about Masimo Corp's financials and stock price? Try the links below:Masimo Corp (MASI) Stock Price | Nasdaq
Masimo Corp (MASI) Stock Quote, History and News - Yahoo Finance
Masimo Corp (MASI) Stock Price and Basic Information | MarketWatch
Loading social stream, please wait...