MBIA Inc. (MBI): Price and Financial Metrics

MBIA Inc. (MBI): $7.34

0.04 (-0.54%)

POWR Rating

Component Grades

Momentum

A

Stability

D

Sentiment

Quality

C

MBI Price/Volume Stats
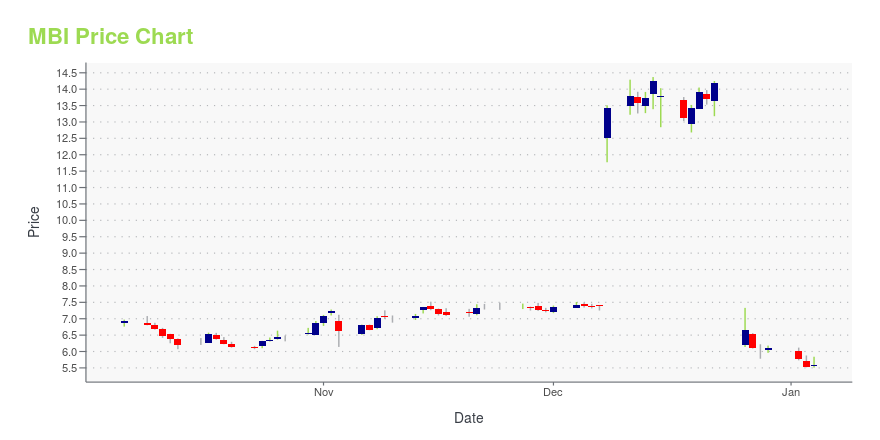
Current price $7.34 52-week high $14.00
Prev. close $7.38 52-week low $6.07
Day low $7.32 Volume 122,901
Day high $7.46 Avg. volume 401,432
50-day MA $6.91 Dividend yield N/A
200-day MA $8.52 Market Cap 375.36M

MBI Stock Price Chart Interactive Chart >

MBI POWR Grades

  • Momentum is the dimension where MBI ranks best; there it ranks ahead of 96.11% of US stocks.
  • The strongest trend for MBI is in Sentiment, which has been heading down over the past 177 days.
  • MBI ranks lowest in Value; there it ranks in the 0th percentile.

MBI Stock Summary

  • The ratio of debt to operating expenses for MBIA INC is higher than it is for about 97.78% of US stocks.
  • Equity multiplier, or assets relative to shareholders' equity, comes in at -3.21 for MBIA INC; that's greater than it is for merely 4.32% of US stocks.
  • MBIA INC's shareholder yield -- a measure of how much capital is returned to stockholders via dividends and buybacks -- is 36.35%, greater than the shareholder yield of 94.87% of stocks in our set.
  • Stocks that are quantitatively similar to MBI, based on their financial statements, market capitalization, and price volatility, are AAIC, BNL, LOAN, GHI, and CURO.
  • Visit MBI's SEC page to see the company's official filings. To visit the company's web site, go to www.mbia.com.

MBI Valuation Summary

  • In comparison to the median Financial Services stock, MBI's EV/EBIT ratio is 266.07% lower, now standing at -18.6.
  • MBI's price/sales ratio has moved down 2.5 over the prior 243 months.

Below are key valuation metrics over time for MBI.

Stock Date P/S P/B P/E EV/EBIT
MBI 2023-11-28 4.0 -0.3 -0.9 -18.6
MBI 2023-11-27 4.0 -0.3 -0.9 -18.6
MBI 2023-11-24 4.0 -0.3 -0.9 -18.6
MBI 2023-11-22 3.9 -0.3 -0.9 -18.6
MBI 2023-11-21 3.9 -0.3 -0.9 -18.6
MBI 2023-11-20 3.9 -0.3 -0.9 -18.6

MBI Growth Metrics

    The 2 year cash and equivalents growth rate now stands at -30.41%.
  • Its 4 year revenue growth rate is now at -33.92%.
  • Its 4 year net cashflow from operations growth rate is now at 41.72%.
MBI's revenue has moved down $287,000,000 over the prior 52 months.

The table below shows MBI's growth in key financial areas (numbers in millions of US dollars).

Date Revenue Operating Cash Flow Net Income to Common Stock
2022-12-31 154 -418 -195
2022-09-30 124 292 -298
2022-06-30 179 198 -387
2022-03-31 157 255 -412
2021-12-31 189 511 -445
2021-09-30 265 357 -371

MBI's Quality Factors

The “Quality” component of the POWR Ratings focuses on 31 different factors of a companies fundamentals and operational strength. Here are some key insights as we drill into the specifics of these quality attributes.
  • MBI has a Quality Grade of C, ranking ahead of 48.26% of graded US stocks.
  • MBI's asset turnover comes in at 0.05 -- ranking 121st of 133 Insurance stocks.
  • LNC, VOYA, and ERIE are the stocks whose asset turnover ratios are most correlated with MBI.

The table below shows MBI's key quality metrics over time.

Period Asset Turnover Gross Margin ROIC
2021-09-30 0.050 -0.264 -0.021
2021-06-30 0.046 0.023 -0.011
2021-03-31 0.059 -0.069 -0.014
2020-12-31 0.044 -0.879 -0.034
2020-09-30 0.031 -1.802 -0.043
2020-06-30 0.044 -0.685 -0.028

MBI Price Target

For more insight on analysts targets of MBI, see our MBI price target page. And for a list of of all stocks sorted by upside potential based on analyst target price, see our Top Price Target page.

Average Price Target $12.00 Average Broker Recommendation 1.83 (Hold)

MBIA Inc. (MBI) Company Bio


MBIA Inc. provides financial guarantee insurance services to public finance markets in the United States and internationally. The company operates through U.S. Public Finance Insurance, and International and Structured Finance Insurance segments. It issues financial guarantees for municipal bonds, including tax-exempt and taxable indebtedness, as well as utility districts, airports, health care institutions, higher educational facilities, student loan issuers, housing authorities, and other similar agencies and obligations issued by private entities. The company was founded in 1973 and is based in Purchase, New York.


MBI Latest News Stream


Event/Time News Detail
Loading, please wait...

MBI Latest Social Stream


Loading social stream, please wait...

View Full MBI Social Stream

Latest MBI News From Around the Web

Below are the latest news stories about MBIA INC that investors may wish to consider to help them evaluate MBI as an investment opportunity.

MBIA Inc. (NYSE:MBI) Q3 2023 Earnings Call Transcript

MBIA Inc. (NYSE:MBI) Q3 2023 Earnings Call Transcript November 5, 2023 Operator: Welcome to the MBIA Inc. Third Quarter 2023 Financial Results Conference Call. I would now like to turn the call over to Greg Diamond, Managing Director of Investor and Media Relations at MBIA Inc. Please go ahead, sir. Greg Diamond: Very good. Thank […]

Yahoo | November 6, 2023

Q3 2023 MBIA Inc Earnings Call

Q3 2023 MBIA Inc Earnings Call

Yahoo | November 4, 2023

MBIA (MBI) Reports Q3 Loss, Tops Revenue Estimates

MBIA (MBI) delivered earnings and revenue surprises of -5,740% and 24.14%, respectively, for the quarter ended September 2023. Do the numbers hold clues to what lies ahead for the stock?

Yahoo | November 2, 2023

MBIA Inc (MBI) Reports Q3 2023 Net Loss of $185 Million

Increased losses and LAE at National Public Finance Guarantee Corporation contribute to unfavorable results

Yahoo | November 2, 2023

MBIA Inc. Reports Third Quarter 2023 Financial Results

PURCHASE, N.Y., November 02, 2023--MBIA Inc. (NYSE:MBI) today posted its third quarter 2023 financial results on its website at https://investor.mbia.com/investor-relations/financial-information/default.aspx. The financial results will also be furnished to the Securities and Exchange Commission (SEC) on a Current Report on Form 8-K available at sec.gov.

Yahoo | November 2, 2023

Read More 'MBI' Stories Here

MBI Price Returns

1-mo 7.78%
3-mo -12.41%
6-mo -13.75%
1-year -39.84%
3-year 10.04%
5-year -15.54%
YTD -42.88%
2022 -18.62%
2021 139.97%
2020 -29.25%
2019 4.26%
2018 21.86%

Continue Researching MBI

Want to see what other sources are saying about Mbia Inc's financials and stock price? Try the links below:

Mbia Inc (MBI) Stock Price | Nasdaq
Mbia Inc (MBI) Stock Quote, History and News - Yahoo Finance
Mbia Inc (MBI) Stock Price and Basic Information | MarketWatch

Get Free Updates

Join thousands of investors who get the latest news, insights and top rated picks from StockNews.com!