
Mobileye Global Inc. (MBLY): Price and Financial Metrics
MBLY Price/Volume Stats
| Current price | $11.77 | 52-week high | $33.26 |
| Prev. close | $11.90 | 52-week low | $10.48 |
| Day low | $11.58 | Volume | 2,298,772 |
| Day high | $11.92 | Avg. volume | 5,335,723 |
| 50-day MA | $15.12 | Dividend yield | N/A |
| 200-day MA | $16.20 | Market Cap | 9.55B |
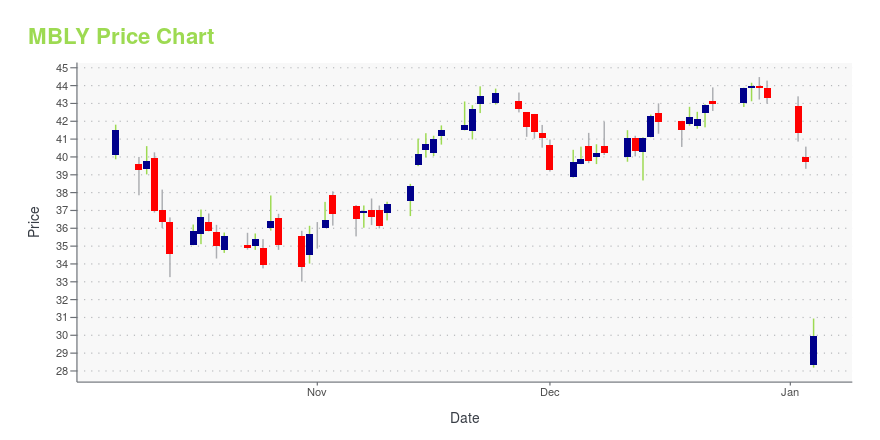
MBLY Stock Price Chart Interactive Chart >
MBLY Price Returns
| 1-mo | -19.16% |
| 3-mo | -29.39% |
| 6-mo | -6.36% |
| 1-year | -61.07% |
| 3-year | N/A |
| 5-year | N/A |
| YTD | -40.91% |
| 2024 | -54.02% |
| 2023 | 23.56% |
| 2022 | N/A |
| 2021 | N/A |
| 2020 | N/A |
Loading social stream, please wait...