Malibu Boats, Inc. (MBUU): Price and Financial Metrics
MBUU Price/Volume Stats
Current price | $43.05 | 52-week high | $62.36 |
Prev. close | $42.05 | 52-week low | $37.70 |
Day low | $42.14 | Volume | 129,911 |
Day high | $43.35 | Avg. volume | 246,341 |
50-day MA | $44.49 | Dividend yield | N/A |
200-day MA | $49.81 | Market Cap | 879.55M |
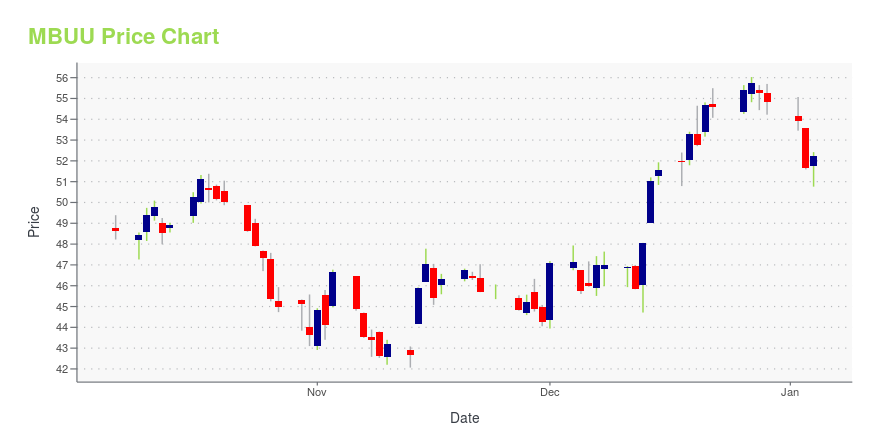
MBUU Stock Price Chart Interactive Chart >
MBUU POWR Grades
- MBUU scores best on the Value dimension, with a Value rank ahead of 54.74% of US stocks.
- The strongest trend for MBUU is in Quality, which has been heading down over the past 26 weeks.
- MBUU's current lowest rank is in the Growth metric (where it is better than 9.45% of US stocks).
MBUU Stock Summary
- Of note is the ratio of MALIBU BOATS INC's sales and general administrative expense to its total operating expenses; 81.9% of US stocks have a lower such ratio.
- MBUU's price/sales ratio is 0.78; that's higher than the P/S ratio of 25.42% of US stocks.
- Equity multiplier, or assets relative to shareholders' equity, comes in at 1.49 for MALIBU BOATS INC; that's greater than it is for only 24.63% of US stocks.
- Stocks with similar financial metrics, market capitalization, and price volatility to MALIBU BOATS INC are GNE, NUS, KMT, COLM, and FHI.
- Visit MBUU's SEC page to see the company's official filings. To visit the company's web site, go to www.malibuboats.com.
MBUU Valuation Summary
- In comparison to the median Consumer Cyclical stock, MBUU's EV/EBIT ratio is 39.22% lower, now standing at 9.3.
- Over the past 121 months, MBUU's price/sales ratio has gone down 0.2.
Below are key valuation metrics over time for MBUU.
Stock | Date | P/S | P/B | P/E | EV/EBIT |
---|---|---|---|---|---|
MBUU | 2023-12-29 | 0.8 | 1.8 | 12.4 | 9.3 |
MBUU | 2023-12-28 | 0.8 | 1.8 | 12.5 | 9.4 |
MBUU | 2023-12-27 | 0.8 | 1.8 | 12.7 | 9.5 |
MBUU | 2023-12-26 | 0.8 | 1.8 | 12.6 | 9.4 |
MBUU | 2023-12-22 | 0.8 | 1.8 | 12.4 | 9.3 |
MBUU | 2023-12-21 | 0.8 | 1.8 | 12.4 | 9.3 |
MBUU Growth Metrics
- Its 3 year revenue growth rate is now at 81.32%.
- Its 5 year price growth rate is now at 67.38%.
- The 3 year net cashflow from operations growth rate now stands at 159.06%.
The table below shows MBUU's growth in key financial areas (numbers in millions of US dollars).
Date | Revenue | Operating Cash Flow | Net Income to Common Stock |
---|---|---|---|
2022-12-31 | 1,338.436 | 157.692 | 170.842 |
2022-09-30 | 1,263.591 | 172.849 | 165.571 |
2022-06-30 | 1,214.877 | 164.846 | 157.632 |
2022-03-31 | 1,138.393 | 149.987 | 143.44 |
2021-12-31 | 1,067.268 | 116.679 | 124.358 |
2021-09-30 | 999.028 | 122.238 | 115.692 |
MBUU's Quality Factors
The “Quality” component of the POWR Ratings focuses on 31 different factors of a companies fundamentals and operational strength. Here are some key insights as we drill into the specifics of these quality attributes.- MBUU has a Quality Grade of C, ranking ahead of 52.02% of graded US stocks.
- MBUU's asset turnover comes in at 1.379 -- ranking 3rd of 10 Shipbuilding Railroad Equipment stocks.
- HII, MPX, and TRN are the stocks whose asset turnover ratios are most correlated with MBUU.
The table below shows MBUU's key quality metrics over time.
Period | Asset Turnover | Gross Margin | ROIC |
---|---|---|---|
2021-09-30 | 1.379 | 0.251 | 0.432 |
2021-06-30 | 1.391 | 0.255 | 0.424 |
2021-03-31 | 1.282 | 0.248 | 0.349 |
2020-12-31 | 1.196 | 0.243 | 0.304 |
2020-09-30 | 1.279 | 0.234 | 0.312 |
2020-06-30 | 1.287 | 0.229 | 0.285 |
MBUU Price Target
For more insight on analysts targets of MBUU, see our MBUU price target page. And for a list of of all stocks sorted by upside potential based on analyst target price, see our Top Price Target page.
Average Price Target | $93.75 | Average Broker Recommendation | 1.38 (Strong Buy) |
Malibu Boats, Inc. (MBUU) Company Bio
Malibu Boats is a leading designer, manufacturer and marketer of performance sport boats. The company was founded in 1982 and is based in Loudon, Tennessee.
Latest MBUU News From Around the Web
Below are the latest news stories about MALIBU BOATS INC that investors may wish to consider to help them evaluate MBUU as an investment opportunity.
Shopify and Malibu Boats have been highlighted as Zacks Bull and Bear of the DayShopify and Malibu Boats are part of the Zacks Bull and Bear of the Day article. |
Bear of the Day: Malibu Boats (MBUU)Malibu Boats is expecting a considerable slowdown in sales growth following the above trend growth of large ticket purchases |
Investors Shouldn't Overlook The Favourable Returns On Capital At Malibu Boats (NASDAQ:MBUU)There are a few key trends to look for if we want to identify the next multi-bagger. Typically, we'll want to notice a... |
Malibu Boats, Inc.'s (NASDAQ:MBUU) Stock Has Been Sliding But Fundamentals Look Strong: Is The Market Wrong?It is hard to get excited after looking at Malibu Boats' (NASDAQ:MBUU) recent performance, when its stock has declined... |
Navigating Choppy WatersA look at 4 prominent players in the sports power boat market |
MBUU Price Returns
1-mo | -2.03% |
3-mo | -21.47% |
6-mo | -12.18% |
1-year | -20.79% |
3-year | -44.17% |
5-year | 8.77% |
YTD | -21.47% |
2023 | 2.85% |
2022 | -22.45% |
2021 | 10.07% |
2020 | 52.48% |
2019 | 17.67% |
Continue Researching MBUU
Want to see what other sources are saying about Malibu Boats Inc's financials and stock price? Try the links below:Malibu Boats Inc (MBUU) Stock Price | Nasdaq
Malibu Boats Inc (MBUU) Stock Quote, History and News - Yahoo Finance
Malibu Boats Inc (MBUU) Stock Price and Basic Information | MarketWatch
Loading social stream, please wait...