
Mednax, Inc. (MD): Price and Financial Metrics
MD Price/Volume Stats
| Current price | $8.24 | 52-week high | $15.02 |
| Prev. close | $8.13 | 52-week low | $6.62 |
| Day low | $8.11 | Volume | 518,142 |
| Day high | $8.42 | Avg. volume | 977,687 |
| 50-day MA | $7.42 | Dividend yield | N/A |
| 200-day MA | $9.02 | Market Cap | 693.37M |
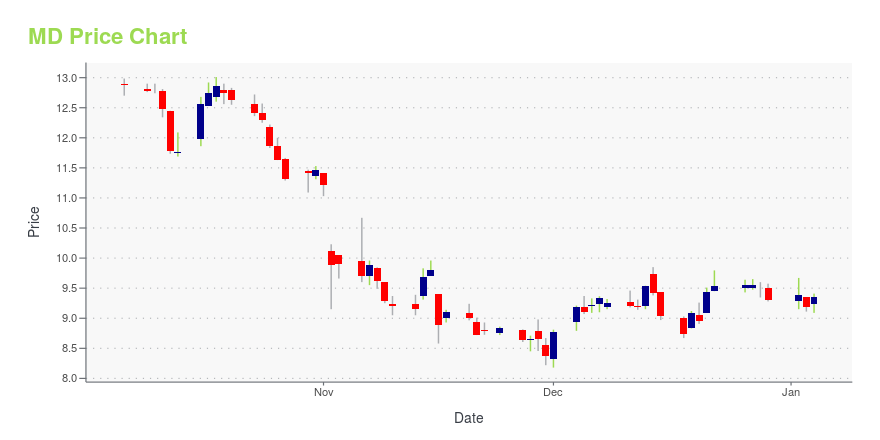
MD Stock Price Chart Interactive Chart >
Mednax, Inc. (MD) Company Bio
MEDNAX Inc. provides neonatal, anesthesia, maternal-fetal, and other pediatric subspecialties physician services in the United States and Puerto Rico. The company was founded in 1979 and is based in Sunrise, Florida.
Latest MD News From Around the Web
Below are the latest news stories about PEDIATRIX MEDICAL GROUP INC that investors may wish to consider to help them evaluate MD as an investment opportunity.
Investors Met With Slowing Returns on Capital At Pediatrix Medical Group (NYSE:MD)To find a multi-bagger stock, what are the underlying trends we should look for in a business? Firstly, we'll want to... |
Miller Children's & Women's Announces New Miller Children's & Women's Neonatal Network in Partnership with Pediatrix Medical Group, Dr. Antoine Soliman Named Regional Medical DirectorMemorialCare Miller Children's & Women's Hospital Long Beach, along with Pediatrix Medical Group, who has been a long-standing neonatology partner with MemorialCare, have come together to create the Miller Children's & Women's Neonatal Network. This new relationship enables coordinated delivery of provider services to the neonatal intensive care unit (NICU) network establishing a forum for improved communication, financial transparency, and shared program and provider planning. The Neonatal Netw |
Pediatrix Medical Group, Inc. (NYSE:MD) Shares Could Be 47% Below Their Intrinsic Value EstimateKey Insights Pediatrix Medical Group's estimated fair value is US$18.35 based on 2 Stage Free Cash Flow to Equity... |
Pediatrix Medical Group Reports Third Quarter ResultsFORT LAUDERDALE, Fla., November 02, 2023--Pediatrix Medical Group Reports Third Quarter Results |
At US$11.41, Is Pediatrix Medical Group, Inc. (NYSE:MD) Worth Looking At Closely?While Pediatrix Medical Group, Inc. ( NYSE:MD ) might not be the most widely known stock at the moment, it received a... |
MD Price Returns
| 1-mo | 7.01% |
| 3-mo | -8.85% |
| 6-mo | -16.43% |
| 1-year | -40.46% |
| 3-year | -71.68% |
| 5-year | -65.44% |
| YTD | -11.40% |
| 2023 | -37.42% |
| 2022 | -45.39% |
| 2021 | 10.88% |
| 2020 | -11.69% |
| 2019 | -15.79% |
Continue Researching MD
Here are a few links from around the web to help you further your research on Mednax Inc's stock as an investment opportunity:Mednax Inc (MD) Stock Price | Nasdaq
Mednax Inc (MD) Stock Quote, History and News - Yahoo Finance
Mednax Inc (MD) Stock Price and Basic Information | MarketWatch
Loading social stream, please wait...