
Medigus Ltd. (MDGS): Price and Financial Metrics
MDGS Price/Volume Stats
| Current price | $2.36 | 52-week high | $7.17 |
| Prev. close | $2.18 | 52-week low | $2.11 |
| Day low | $2.17 | Volume | 28,800 |
| Day high | $2.58 | Avg. volume | 9,658 |
| 50-day MA | $2.75 | Dividend yield | N/A |
| 200-day MA | $3.44 | Market Cap | 3.91M |
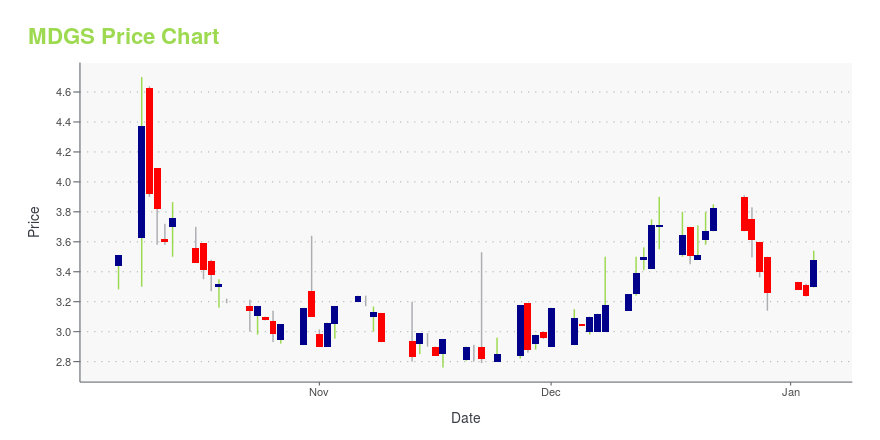
MDGS Stock Price Chart Interactive Chart >
Medigus Ltd. (MDGS) Company Bio
Medigus Ltd. develops endoscopic procedures and devices for the treatment of gastroesophageal reflux disease.
Latest MDGS News From Around the Web
Below are the latest news stories about MEDIGUS LTD that investors may wish to consider to help them evaluate MDGS as an investment opportunity.
Medigus: Charging Robotics Announces Positive Results in Transferring High Voltage Wireless Electricity Needed for EV ChargingTel Aviv, Israel, Dec. 27, 2023 (GLOBE NEWSWIRE) -- Medigus Ltd. (Nasdaq: MDGS), a technology company engaged in advanced medical solutions, innovative internet technologies, and electric vehicle and charging solutions, today announced that Charging Robotics Ltd. ("Charging Robotics"), a subsidiary of Fuel Doctor Holdings, Inc., (“FDOC”) a Delaware corporation listed on the OTC Market (67.15% owned by Medigus), announced today it has successfully completed an important milestone towards the inst |
Charging Robotics, A Subsidiary Of Medigus, Secures Israel Innovation Authority Funding For Wireless EV Parking ChargersMedigus Ltd. (NASDAQ: MDGS) initiated a wireless EV charging pilot through its subsidiary, Charging Robotics Ltd., operating under Fuel Doctor Holdings, Inc. (OTC: FDOC), to address the need of automated parking systems. This initiative has been supported by funding from the Israel Innovation Authority, aligning with the surging need for efficient EV solutions—an area Medigus has ventured into through its subsidiary, Charging Robotics. Pioneering wireless charging, Charging Robotics specializes |
Medigus: Charging Robotics Targets the $1.8 Billion Automated Parking Market for EV Wireless Charging SolutionCharging Robotics received funding from the Israel Innovation Authority for its pilot project to develop and demonstrate its solution for wirelessly charging electric vehicles in automated parking systems. Tel Aviv, Israel, Dec. 26, 2023 (GLOBE NEWSWIRE) -- Medigus Ltd. (Nasdaq: MDGS), a technology company engaged in advanced medical solutions, innovative internet technologies, and electric vehicle and charging solutions, announced the launch of a unique pilot of a wireless charging solution to |
Medigus: ParaZero Successfully Completed its Drone Safety Project with a Fortune 500 Leading Automotive ManufacturerParaZero is furthering its collaboration with the same esteemed customer, having recently secured an additional order Tel Aviv, Israel, Dec. 21, 2023 (GLOBE NEWSWIRE) -- Medigus Ltd. (Nasdaq: MDGS), a technology company engaged in electric vehicle charging solutions, advanced medical solutions, and innovative internet technologies, today announced that on December 20, 2023, ParaZero Technologies Ltd. (PRZO) ("ParaZero"), an aerospace company focused on drone safety systems for commercial drones |
Medigus: Jeffs' Brands Signs a Non-Binding Letter of Intent to Invest in a Remote Wireless Electric Charging Technology CompanyJeffs’ Brands will hold a 70% interest in a new company to be incorporated that will develop laser- based charging solutions for drones and unmanned aircrafts Tel Aviv, Israel, Dec. 18, 2023 (GLOBE NEWSWIRE) -- Medigus Ltd. (Nasdaq: MDGS), a technology company engaged in advanced medical solutions, innovative internet technologies, and electric vehicle and charging solutions, announced that on December 15, 2023, Jeffs' Brands Ltd. (“Jeffs’ Brands”) (owned 34.87% by Medigus) a data-driven E-comme |
MDGS Price Returns
| 1-mo | N/A |
| 3-mo | N/A |
| 6-mo | -25.07% |
| 1-year | -48.18% |
| 3-year | -89.28% |
| 5-year | -92.45% |
| YTD | -27.61% |
| 2023 | -30.19% |
| 2022 | -64.57% |
| 2021 | -47.64% |
| 2020 | 9.77% |
| 2019 | -33.08% |
Continue Researching MDGS
Want to do more research on Medigus Ltd's stock and its price? Try the links below:Medigus Ltd (MDGS) Stock Price | Nasdaq
Medigus Ltd (MDGS) Stock Quote, History and News - Yahoo Finance
Medigus Ltd (MDGS) Stock Price and Basic Information | MarketWatch
Loading social stream, please wait...