
Mondelez International Inc. Cl A (MDLZ): Price and Financial Metrics
MDLZ Price/Volume Stats
| Current price | $66.42 | 52-week high | $77.20 |
| Prev. close | $66.39 | 52-week low | $60.75 |
| Day low | $65.91 | Volume | 5,778,400 |
| Day high | $66.80 | Avg. volume | 7,204,317 |
| 50-day MA | $67.22 | Dividend yield | 2.58% |
| 200-day MA | $69.75 | Market Cap | 89.09B |
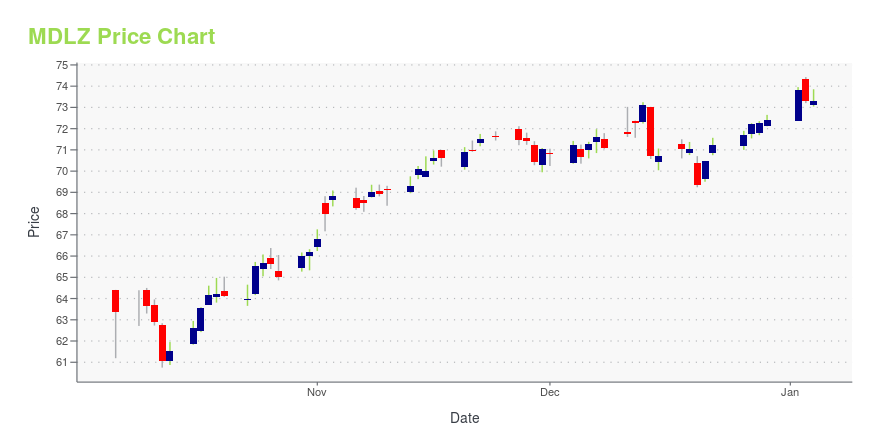
MDLZ Stock Price Chart Interactive Chart >
Mondelez International Inc. Cl A (MDLZ) Company Bio
Mondelez International Inc is associated with the confectionery industry. It manufactures and markets snack food and beverage products like biscuits, chocolate, gum and candy, and beverages to over 150 countries around the world. Mondelez International has operations in more than 80 countries and employs nearly 80,000 people in the company’s factories, offices, research and development facilities, and distribution centers across the globe. The products the company markets includes such brand names as belVita, Cadbury, Chips Ahoy!, Halls, Honey Maid, Oreo, Ritz, Trident, and Wheat Thins. Mondelez International is headquartered in Chicago, Illinois and Dirk Van de Put serves as Chairman of the Board and Chief Executive Officer.
Latest MDLZ News From Around the Web
Below are the latest news stories about MONDELEZ INTERNATIONAL INC that investors may wish to consider to help them evaluate MDLZ as an investment opportunity.
Do Fundamentals Have Any Role To Play In Driving Mondelez International, Inc.'s (NASDAQ:MDLZ) Stock Up Recently?Mondelez International's (NASDAQ:MDLZ) stock is up by 4.0% over the past three months. Given that stock prices are... |
Mondelez International Inc's Dividend AnalysisMondelez International Inc (NASDAQ:MDLZ) recently announced a dividend of $0.43 per share, payable on 2024-01-12, with the ex-dividend date set for 2023-12-28. As investors look forward to this upcoming payment, the spotlight also shines on the company's dividend history, yield, and growth rates. Using the data from GuruFocus, let's look into Mondelez International Inc's dividend performance and assess its sustainability. |
Worst of the Cocoa Rally Is Yet to Come for Chocolate Makers(Bloomberg) -- The world’s largest chocolate makers are yet to see the full impact of a rally that sent cocoa futures to a 46-year high.Most Read from BloombergChinese Carmaker Overtakes Tesla as World’s Most Popular EV MakerThe Late-Night Email to Tim Cook That Set the Apple Watch Saga in MotionApple Resumes Sale of Watches After Appeals Court Lifts US BanS&P 500 Rally Flashes Signs of Fatigue Near Record: Markets WrapTesla Plans Revamp of Smash Hit Model Y From China PlantCompanies including H |
Hershey's bitter ending to 2023 shows innovation will be key to success in 2024, says analystThe Consumer Staples Select Sector is also under pressure. |
Will Strategic Efforts Fuel Mondelez's (MDLZ) Growth in 2024?Mondelez's (MDLZ) emphasis on the snacking category, regular innovation, acquisitions and effective pricing strategies bodes well amid rising costs. |
MDLZ Price Returns
| 1-mo | 0.31% |
| 3-mo | -5.33% |
| 6-mo | -10.49% |
| 1-year | -5.93% |
| 3-year | 9.23% |
| 5-year | 35.73% |
| YTD | -7.15% |
| 2023 | 11.17% |
| 2022 | 2.92% |
| 2021 | 15.87% |
| 2020 | 8.58% |
| 2019 | 40.42% |
MDLZ Dividends
| Ex-Dividend Date | Type | Payout Amount | Change | ||||||
|---|---|---|---|---|---|---|---|---|---|
| Loading, please wait... | |||||||||
Continue Researching MDLZ
Want to do more research on Mondelez International Inc's stock and its price? Try the links below:Mondelez International Inc (MDLZ) Stock Price | Nasdaq
Mondelez International Inc (MDLZ) Stock Quote, History and News - Yahoo Finance
Mondelez International Inc (MDLZ) Stock Price and Basic Information | MarketWatch
Loading social stream, please wait...