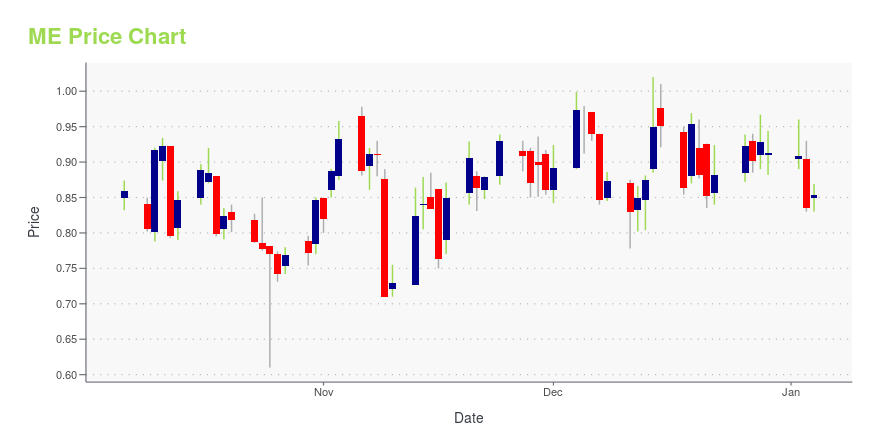
23andMe Holding Co. Class A Common Stock (ME): Price and Financial Metrics
ME Price/Volume Stats
| Current price | $0.61 | 52-week high | $12.76 |
| Prev. close | $0.77 | 52-week low | $0.53 |
| Day low | $0.60 | Volume | 29,751,400 |
| Day high | $1.10 | Avg. volume | 4,056,025 |
| 50-day MA | $2.29 | Dividend yield | N/A |
| 200-day MA | $5.05 | Market Cap | 16.27M |
ME Stock Price Chart Interactive Chart >
23andMe Holding Co. Class A Common Stock (ME) Company Bio
23andMe, Inc., a consumer genetics and research company, engages in developing a genetic database to unlock insights leading to the rapid discovery of new targets for drug development. It offers a crowdsourced platform that helps people to access, understand, and benefit from the human genome; access direct-to-consumer genetic testing; and give consumers personalized information about their genetic health risks, ancestry, and traits. The company was incorporated in 2006 and is based in Sunnyvale, California with an additional office in Mountain View, California.
ME Price Returns
| 1-mo | -66.85% |
| 3-mo | -83.10% |
| 6-mo | -87.58% |
| 1-year | -93.97% |
| 3-year | -99.12% |
| 5-year | N/A |
| YTD | -81.23% |
| 2024 | -82.21% |
| 2023 | -57.71% |
| 2022 | -67.57% |
| 2021 | -41.73% |
| 2020 | N/A |


Loading social stream, please wait...