Medpace Holdings, Inc. (MEDP): Price and Financial Metrics
MEDP Price/Volume Stats
Current price | $242.69 | 52-week high | $282.73 |
Prev. close | $240.81 | 52-week low | $141.30 |
Day low | $240.81 | Volume | 416,500 |
Day high | $249.97 | Avg. volume | 337,384 |
50-day MA | $259.64 | Dividend yield | N/A |
200-day MA | $221.75 | Market Cap | 7.42B |
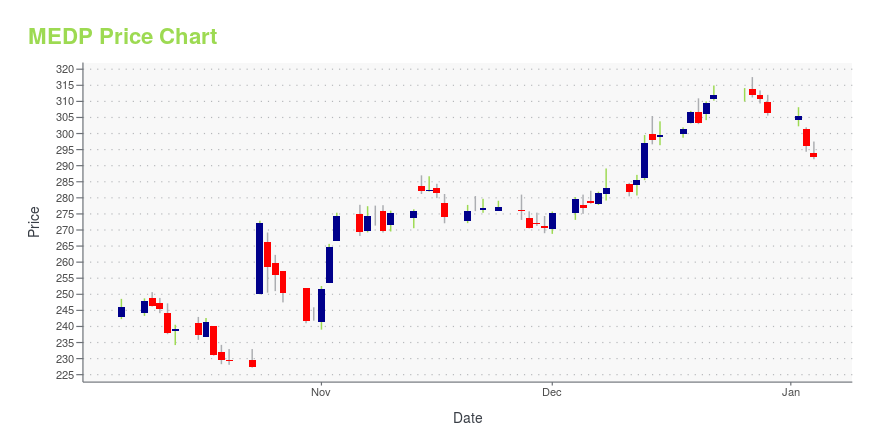
MEDP Stock Price Chart Interactive Chart >
MEDP POWR Grades
- MEDP scores best on the Quality dimension, with a Quality rank ahead of 95.66% of US stocks.
- The strongest trend for MEDP is in Quality, which has been heading up over the past 179 days.
- MEDP's current lowest rank is in the Momentum metric (where it is better than 10.96% of US stocks).
MEDP Stock Summary
- MEDPACE HOLDINGS INC's market capitalization of $8,346,693,306 is ahead of 82.28% of US-listed equities.
- MEDPACE HOLDINGS INC's capital turnover -- a measure of revenue relative to shareholder's equity -- is better than 88.58% of US listed stocks.
- With a year-over-year growth in debt of -49.47%, MEDPACE HOLDINGS INC's debt growth rate surpasses merely 5.72% of about US stocks.
- Stocks that are quantitatively similar to MEDP, based on their financial statements, market capitalization, and price volatility, are EXLS, PRFT, PAYS, EPAM, and INDO.
- MEDP's SEC filings can be seen here. And to visit MEDPACE HOLDINGS INC's official web site, go to www.medpace.com.
MEDP Valuation Summary
- MEDP's price/sales ratio is 5; this is 163.16% higher than that of the median Healthcare stock.
- MEDP's price/sales ratio has moved up 1.9 over the prior 86 months.
Below are key valuation metrics over time for MEDP.
Stock | Date | P/S | P/B | P/E | EV/EBIT |
---|---|---|---|---|---|
MEDP | 2023-09-18 | 5.0 | 21.3 | 31.1 | 26.4 |
MEDP | 2023-09-15 | 5.1 | 21.9 | 31.9 | 27.1 |
MEDP | 2023-09-14 | 5.1 | 21.9 | 31.9 | 27.1 |
MEDP | 2023-09-13 | 5.1 | 22.0 | 32.0 | 27.2 |
MEDP | 2023-09-12 | 5.1 | 21.8 | 31.8 | 27.0 |
MEDP | 2023-09-11 | 5.1 | 21.8 | 31.8 | 27.0 |
MEDP Growth Metrics
- The 4 year revenue growth rate now stands at 111.37%.
- The 4 year cash and equivalents growth rate now stands at 258.22%.
- Its 2 year cash and equivalents growth rate is now at -38.18%.

The table below shows MEDP's growth in key financial areas (numbers in millions of US dollars).
Date | Revenue | Operating Cash Flow | Net Income to Common Stock |
---|---|---|---|
2022-09-30 | 1,374.45 | 322.26 | 226.732 |
2022-06-30 | 1,286.273 | 286.122 | 209.279 |
2022-03-31 | 1,213.359 | 252.264 | 199.853 |
2021-12-31 | 1,142.377 | 263.327 | 181.848 |
2021-09-30 | 1,093.503 | 297.931 | 182.68 |
2021-06-30 | 1,028.309 | 285.341 | 175.566 |
MEDP's Quality Factors
The “Quality” component of the POWR Ratings focuses on 31 different factors of a companies fundamentals and operational strength. Here are some key insights as we drill into the specifics of these quality attributes.- MEDP has a Quality Grade of B, ranking ahead of 87.66% of graded US stocks.
- MEDP's asset turnover comes in at 0.743 -- ranking 204th of 563 Business Services stocks.
- RMBL, INS, and TWOU are the stocks whose asset turnover ratios are most correlated with MEDP.
The table below shows MEDP's key quality metrics over time.
Period | Asset Turnover | Gross Margin | ROIC |
---|---|---|---|
2021-09-30 | 0.743 | 0.295 | 2.623 |
2021-06-30 | 0.733 | 0.302 | 2.272 |
2021-03-31 | 0.713 | 0.306 | 1.804 |
2020-12-31 | 0.734 | 0.301 | 2.074 |
2020-09-30 | 0.747 | 0.289 | 2.469 |
2020-06-30 | 0.771 | 0.282 | 4.109 |
MEDP Price Target
For more insight on analysts targets of MEDP, see our MEDP price target page. And for a list of of all stocks sorted by upside potential based on analyst target price, see our Top Price Target page.
Average Price Target | $182.00 | Average Broker Recommendation | 1.75 (Moderate Buy) |
Medpace Holdings, Inc. (MEDP) Company Bio
Medpace, Inc. operates as a contract research organization that provides research based drug and medical device development services. The company was founded in 1992 and is based in Cincinnati, Ohio.
Latest MEDP News From Around the Web
Below are the latest news stories about MEDPACE HOLDINGS INC that investors may wish to consider to help them evaluate MEDP as an investment opportunity.
Unveiling Medpace Holdings (MEDP)'s Value: Is It Really Priced Right? A Comprehensive GuideDelving into the intrinsic value of Medpace Holdings Inc (MEDP) and its potential for long-term returns |
Medpace Holdings, Inc. (MEDP) Hits Fresh High: Is There Still Room to Run?Medpace (MEDP) is at a 52-week high, but can investors hope for more gains in the future? We take a look at the company's fundamentals for clues. |
Zacks.com featured highlights include Medpace, Invitation Home and RyanairMedpace, Invitation Home and Ryanair are part of the Zacks Screen of the Week article. |
3 Top Stocks Exhibiting Superb Earnings GrowthInvest in stocks such as Medpace Holdings (MEDP), Invitation Home (INVH) and Ryanair Holdings (RYAAY) for solid earnings growth. |
Reasons for the Outperformance of Medpace Holdings (MEDP)Investment management company Vulcan Value Partners recently released its second-quarter 2023 investor letter. A copy of the same can be downloaded here. The firm has five strategies, and all gained positive absolute returns in the second quarter. The fund’s Large Cap Composite returned 10.0% net of fees and expenses, the Small Cap Composite returned 4.4% net, the Focus […] |
MEDP Price Returns
1-mo | -6.59% |
3-mo | 7.81% |
6-mo | 33.70% |
1-year | 66.93% |
3-year | 126.94% |
5-year | 314.22% |
YTD | 14.26% |
2022 | -2.40% |
2021 | 56.35% |
2020 | 65.60% |
2019 | 58.81% |
2018 | 45.97% |
Continue Researching MEDP
Here are a few links from around the web to help you further your research on Medpace Holdings Inc's stock as an investment opportunity:Medpace Holdings Inc (MEDP) Stock Price | Nasdaq
Medpace Holdings Inc (MEDP) Stock Quote, History and News - Yahoo Finance
Medpace Holdings Inc (MEDP) Stock Price and Basic Information | MarketWatch
Loading social stream, please wait...