Mercer International Inc. (MERC): Price and Financial Metrics
GET POWR RATINGS... FREE!
MERC POWR Grades
- Growth is the dimension where MERC ranks best; there it ranks ahead of 98.34% of US stocks.
- The strongest trend for MERC is in Sentiment, which has been heading up over the past 179 days.
- MERC's current lowest rank is in the Quality metric (where it is better than 54.41% of US stocks).
MERC Stock Summary
- With a one year PEG ratio of 1.46, Mercer International Inc is expected to have a higher PEG ratio (a measure of how expensive a stock is relative to its expected earnings growth) than just 7.3% of US stocks.
- For MERC, its debt to operating expenses ratio is greater than that reported by 95.28% of US equities we're observing.
- In terms of twelve month growth in earnings before interest and taxes, Mercer International Inc is reporting a growth rate of 374.97%; that's higher than 94.19% of US stocks.
- If you're looking for stocks that are quantitatively similar to Mercer International Inc, a group of peers worth examining would be LOAN, OLN, NATH, SUNS, and AGRO.
- Visit MERC's SEC page to see the company's official filings. To visit the company's web site, go to www.mercerint.com.
MERC Valuation Summary
- In comparison to the median Basic Materials stock, MERC's price/sales ratio is 68.75% lower, now standing at 0.5.
- Over the past 243 months, MERC's EV/EBIT ratio has gone up 5.9.
- Over the past 243 months, MERC's price/sales ratio has gone down 0.1.
Below are key valuation metrics over time for MERC.
Stock | Date | P/S | P/B | P/E | EV/EBIT |
---|---|---|---|---|---|
MERC | 2021-09-03 | 0.5 | 1.3 | 34.7 | 14.3 |
MERC | 2021-09-02 | 0.5 | 1.2 | 34.4 | 14.2 |
MERC | 2021-09-01 | 0.5 | 1.2 | 34.3 | 14.2 |
MERC | 2021-08-31 | 0.5 | 1.2 | 34.3 | 14.2 |
MERC | 2021-08-30 | 0.5 | 1.3 | 34.5 | 14.3 |
MERC | 2021-08-27 | 0.5 | 1.3 | 35.3 | 14.4 |
MERC Growth Metrics
- Its year over year net cashflow from operations growth rate is now at 7.14%.
- Its 2 year cash and equivalents growth rate is now at 34.16%.
- Its year over year cash and equivalents growth rate is now at 37.89%.

The table below shows MERC's growth in key financial areas (numbers in millions of US dollars).
Date | Revenue | Operating Cash Flow | Net Income to Common Stock |
---|---|---|---|
2021-12-31 | 1,803.255 | 182.214 | 170.988 |
2021-09-30 | 1,682.493 | 170.398 | 83.489 |
2021-06-30 | 1,545.898 | 158.742 | 21.916 |
2021-03-31 | 1,485.261 | 141.695 | -7.91 |
2020-12-31 | 1,423.14 | 41.565 | -17.235 |
2020-09-30 | 1,356.117 | 79.266 | -76.979 |
MERC's Quality Factors
The “Quality” component of the POWR Ratings focuses on 31 different factors of a companies fundamentals and operational strength. Here are some key insights as we drill into the specifics of these quality attributes.- MERC has a Quality Grade of C, ranking ahead of 44.12% of graded US stocks.
- MERC's asset turnover comes in at 0.769 -- ranking 12th of 21 Business Supplies stocks.
- RFP, SCS, and AVY are the stocks whose asset turnover ratios are most correlated with MERC.
The table below shows MERC's key quality metrics over time.
Period | Asset Turnover | Gross Margin | ROIC |
---|---|---|---|
2021-09-30 | 0.769 | 0.184 | 0.074 |
2021-06-30 | 0.722 | 0.133 | 0.041 |
2021-03-31 | 0.714 | 0.108 | 0.028 |
2020-12-31 | 0.703 | 0.092 | 0.026 |
2020-09-30 | 0.675 | 0.038 | -0.003 |
2020-06-30 | 0.708 | 0.042 | -0.005 |
MERC Price Target
For more insight on analysts targets of MERC, see our MERC price target page. And for a list of of all stocks sorted by upside potential based on analyst target price, see our Top Price Target page.
Average Price Target | $20.70 | Average Broker Recommendation | 1.7 (Moderate Buy) |
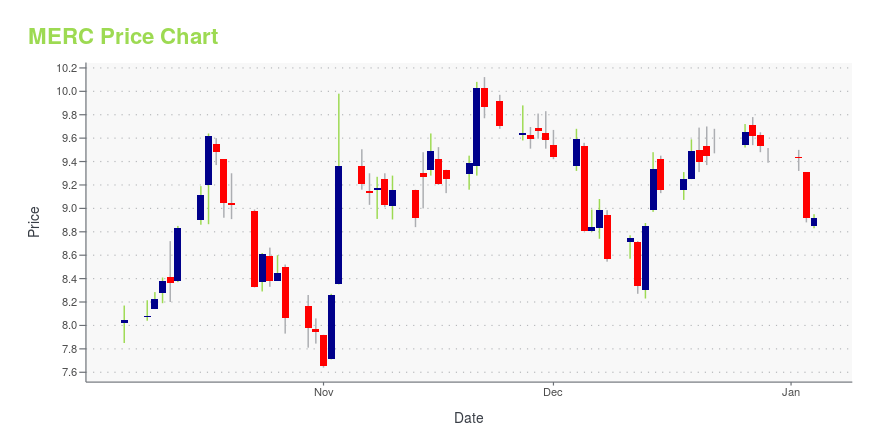
MERC Stock Price Chart Interactive Chart >
MERC Price/Volume Stats
Current price | $12.97 | 52-week high | $17.17 |
Prev. close | $12.83 | 52-week low | $9.51 |
Day low | $12.70 | Volume | 212,000 |
Day high | $13.21 | Avg. volume | 311,480 |
50-day MA | $15.06 | Dividend yield | 2.31% |
200-day MA | $12.79 | Market Cap | 857.73M |
Mercer International Inc. (MERC) Company Bio
Mercer International manufactures and sells northern bleached softwood kraft (NBSK) pulp worldwide. The company was founded in 1968 and is based in Vancouver, Canada.
Latest MERC News From Around the Web
Below are the latest news stories about Mercer International Inc that investors may wish to consider to help them evaluate MERC as an investment opportunity.
Are These Basic Materials Stocks a Great Value Stocks Right Now?Here at Zacks, our focus is on the proven Zacks Rank system, which emphasizes earnings estimates and estimate revisions to find great stocks. Nevertheless, we are always paying attention to the latest value, growth, and momentum trends to underscore strong picks. |
Mercer International (MERC)'s Technical Outlook is Bright After Key Golden CrossIs it a good or bad thing when a stock experiences a golden cross technical event? |
Mercer International Inc. Reports Fourth Quarter and Year End 2021 Results and Increases Quarterly Cash Dividend by 15% to $0.075Selected Highlights Fourth quarter net income of $74.5 million and record Operating EBITDA* of $164.9 millionFull year 2021 record net income of $171.0 million and Operating EBITDA* of $478.8 million NEW YORK, Feb. 17, 2022 (GLOBE NEWSWIRE) -- Mercer International Inc. (Nasdaq: MERC) today reported fourth quarter 2021 Operating EBITDA increased to a record $164.9 million from $49.5 million in the fourth quarter of 2020 and from $148.1 million in the third quarter of 2021. In the fourth quarter o |
Is Hawkins (HWKN) Outperforming Other Basic Materials Stocks This Year?Here is how Hawkins (HWKN) and Mercer International (MERC) have performed compared to their sector so far this year. |
Are These Basic Materials Stocks Undervalued Right Now?Here at Zacks, our focus is on the proven Zacks Rank system, which emphasizes earnings estimates and estimate revisions to find great stocks. Nevertheless, we are always paying attention to the latest value, growth, and momentum trends to underscore strong picks. |
MERC Price Returns
1-mo | -12.01% |
3-mo | -9.52% |
6-mo | 10.87% |
1-year | 2.86% |
3-year | -6.73% |
5-year | 32.60% |
YTD | 8.74% |
2021 | 18.30% |
2020 | -12.80% |
2019 | 22.64% |
2018 | -24.32% |
2017 | 39.65% |
MERC Dividends
Ex-Dividend Date | Type | Payout Amount | Change | ||||||
---|---|---|---|---|---|---|---|---|---|
Loading, please wait... |
Continue Researching MERC
Want to do more research on Mercer International Inc's stock and its price? Try the links below:Mercer International Inc (MERC) Stock Price | Nasdaq
Mercer International Inc (MERC) Stock Quote, History and News - Yahoo Finance
Mercer International Inc (MERC) Stock Price and Basic Information | MarketWatch
Loading social stream, please wait...