
MetLife Inc. (MET): Price and Financial Metrics
MET Price/Volume Stats
| Current price | $76.00 | 52-week high | $76.90 |
| Prev. close | $75.32 | 52-week low | $57.91 |
| Day low | $75.09 | Volume | 2,397,119 |
| Day high | $76.40 | Avg. volume | 3,328,661 |
| 50-day MA | $71.84 | Dividend yield | 2.9% |
| 200-day MA | $68.58 | Market Cap | 54.05B |
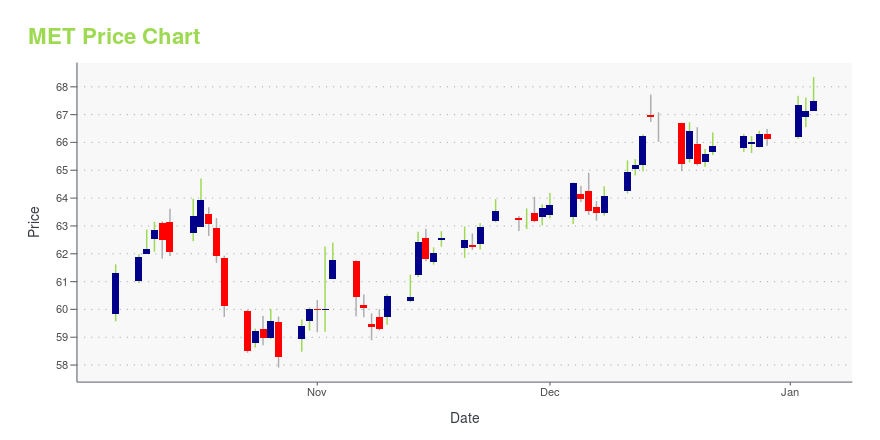
MET Stock Price Chart Interactive Chart >
MetLife Inc. (MET) Company Bio
MetLife, Inc. is the holding corporation for the Metropolitan Life Insurance Company (MLIC), better known asMetLife, and its affiliates. MetLife is among the largest global providers of insurance, annuities, and employee benefit programs, with 90 million customers in over 60 countries. The firm was founded on March 24, 1868. MetLife ranked No. 43 in the 2018 Fortune 500 list of the largest United States corporations by total revenue. (Source:Wikipedia)
Latest MET News From Around the Web
Below are the latest news stories about METLIFE INC that investors may wish to consider to help them evaluate MET as an investment opportunity.
15 Best Pet Insurance Companies Heading into 2024In this article, we will cover the 15 best pet insurance companies heading into 2024. If you want to skip our detailed analysis of the pet insurance market, you can go directly to 5 Best Pet Insurance Companies Heading into 2024. The Global Pet Insurance Market: An Analysis Driven by economic trends, increasing pet adoption, […] |
15 Best Term Life Insurance Companies Heading into 2024In this article, we will look into the 15 best term life insurance companies heading into 2024. If you want to skip our detailed analysis, you can go directly to 5 Best Term Life Insurance Companies Heading into 2024. Term Life Insurance Industry: A Market Analysis According to a report by Grand View Research, the […] |
15 Best Motorhome Insurance Companies Heading into 2024In this article, we will look into the 15 best motorhome insurance companies heading into 2024. If you want to skip our detailed analysis, you can go directly to the 5 Best Motorhome Insurance Companies Heading into 2024. North America RV Insurance: A Market Analysis North America is the biggest shareholder in the global RV […] |
There Is More Value In The Financial Sector Than Any Other SectorThanks to the great recession of 2008 and 2009, there is more value to be found in the financial sector than any other of the 11 sectors. |
15 Best Boat/Yacht Insurance Companies Heading into 2024In this article, we will look into the 15 best boat/yacht insurance companies heading into 2024. If you want to skip our detailed analysis, you can go directly to the 5 Best Boat/Yacht Insurance Companies Heading into 2024. Boat/Yacht Insurance Industry: A Market Analysis According to a report by Verified Market Research, the global boat/yacht […] |
MET Price Returns
| 1-mo | 6.77% |
| 3-mo | 8.76% |
| 6-mo | 8.92% |
| 1-year | 25.99% |
| 3-year | 44.59% |
| 5-year | 78.88% |
| YTD | 16.74% |
| 2023 | -5.49% |
| 2022 | 19.23% |
| 2021 | 37.43% |
| 2020 | -3.42% |
| 2019 | 28.84% |
MET Dividends
| Ex-Dividend Date | Type | Payout Amount | Change | ||||||
|---|---|---|---|---|---|---|---|---|---|
| Loading, please wait... | |||||||||
Continue Researching MET
Here are a few links from around the web to help you further your research on Metlife Inc's stock as an investment opportunity:Metlife Inc (MET) Stock Price | Nasdaq
Metlife Inc (MET) Stock Quote, History and News - Yahoo Finance
Metlife Inc (MET) Stock Price and Basic Information | MarketWatch
Loading social stream, please wait...