
Mercurity Fintech Holding Inc. (MFH): Price and Financial Metrics
MFH Price/Volume Stats
| Current price | $1.96 | 52-week high | $3.50 |
| Prev. close | $1.86 | 52-week low | $0.77 |
| Day low | $1.86 | Volume | 12,384 |
| Day high | $1.96 | Avg. volume | 19,907 |
| 50-day MA | $1.69 | Dividend yield | N/A |
| 200-day MA | $1.73 | Market Cap | 91.23M |
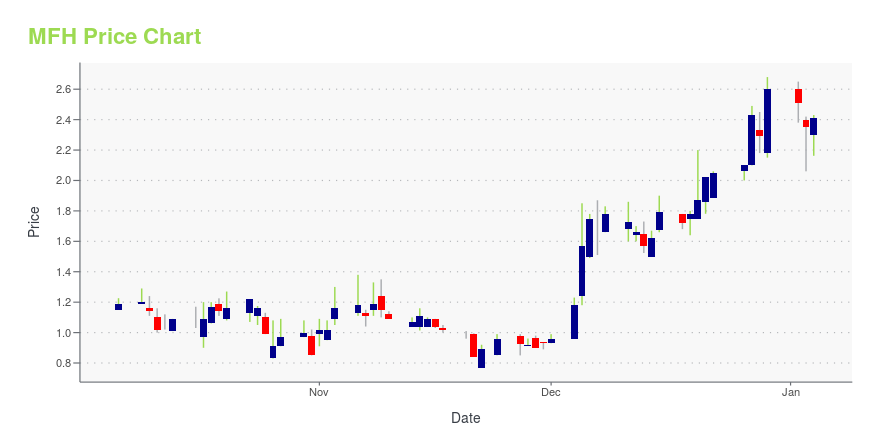
MFH Stock Price Chart Interactive Chart >
Mercurity Fintech Holding Inc. (MFH) Company Bio
Mercurity Fintech Holding Inc. provides internet media services.
Latest MFH News From Around the Web
Below are the latest news stories about MERCURITY FINTECH HOLDING INC that investors may wish to consider to help them evaluate MFH as an investment opportunity.
Mercurity Fintech Holding Inc. Announces $6 Million Private Placement FinancingNew York, Dec. 04, 2023 (GLOBE NEWSWIRE) -- Mercurity Fintech Holding Inc. (the “Company,” “we,” “us,” “our company,” or “MFH”) (Nasdaq: MFH), a digital fintech group, is pleased to announce that on November 30, 2023, it priced a private investment in public equity (“PIPE”) offering, through which it sold an aggregate of 14,251,781 units of its securities, each consisting of one (1) ordinary share and three (3) warrants, to one non-U.S. institutional investor at an offering price of $0.421 per u |
Mercurity Fintech Holding's Subsidiary, Ucon Capital Hong Kong, Earns Distinguished Approval to enter “Cyberport” CommunityHong Kong Digital Finance Initiative “Cyberport” Recognizes Mercurity Fintech Subsidiary Ucon Capital's Expertise and Capability by Granting an Approval to Join Its Prestigious RanksNew York, Aug. 15, 2023 (GLOBE NEWSWIRE) -- Mercurity Fintech Holding Inc. (the “Company,” “we,” “us,” “our company,” or “MFH”) (Nasdaq: MFH), a leading digital fintech group empowered by blockchain technology, today announced that its wholly-owned subsidiary, Ucon Capital (“Ucon”), has been honored with the approval |
Mercurity Fintech Holding Inc. Announces Co-Founding of “Fresh First, Inc.” a Digital, Same-Day, Fresh Food Delivery ServiceNew York, May 25, 2023 (GLOBE NEWSWIRE) -- Mercurity Fintech Holding Inc. (the “Company,” “we,” “us,” “our company,” or “MFH”) (Nasdaq: MFH), a digital fintech group powered by blockchain technology, today announced the co-founding of “Fresh First, Inc.” (“Fresh First”) a same-day meat, produce and grocery delivery service targeting urban, working Americans in higher income brackets willing to pay for fresh, healthy ingredients and convenience. With its unwavering commitment to enhancing the qua |
Mercurity Fintech Holding Subsidiary Purchases Fully Licensed Broker Dealer, Established in 1982MFH takes aim at digital brokerage and wealth management services to reshape the global financial future for retail investorsNew York, May 03, 2023 (GLOBE NEWSWIRE) -- Mercurity Fintech Holding Inc. (the “Company,” “we,” “us,” “our company,” or “MFH”) (Nasdaq: MFH), a digital fintech group powered by blockchain technology, today announced that Chaince Securities, Inc., the financial services subsidiary of MFH entered into a Purchase and Sale Agreement for the acquisition of all assets and liabil |
Mercurity Fintech Holding Inc. Reports Full Fiscal Year 2022 Financial Results with Expanded Revenue Streams and Gross ProfitsNEW YORK, April 25, 2023 (GLOBE NEWSWIRE) -- Mercurity Fintech Holding Inc. (the “Company,” “we,” “us,” “our company,” or “MFH”) (Nasdaq: MFH), a digital fintech group powered by blockchain technology, today announced its financial results for the twelve months concluded on December 31, 2022. Despite challenging market conditions, MFH has made remarkable strides in both its financial performance and business operation. This includes expanding revenue streams, minimizing company losses, enhancing |
MFH Price Returns
| 1-mo | 29.80% |
| 3-mo | 39.01% |
| 6-mo | 2.08% |
| 1-year | -7.11% |
| 3-year | -45.40% |
| 5-year | -18.33% |
| YTD | -24.62% |
| 2023 | 132.68% |
| 2022 | -64.75% |
| 2021 | 3.93% |
| 2020 | 85.98% |
| 2019 | 17.14% |
Loading social stream, please wait...