MGM Resorts International (MGM): Price and Financial Metrics
GET POWR RATINGS... FREE!
MGM POWR Grades
- MGM scores best on the Quality dimension, with a Quality rank ahead of 73.26% of US stocks.
- The strongest trend for MGM is in Stability, which has been heading up over the past 179 days.
- MGM's current lowest rank is in the Stability metric (where it is better than 19.93% of US stocks).
MGM Stock Summary
- Of note is the ratio of MGM Resorts International's sales and general administrative expense to its total operating expenses; 99.1% of US stocks have a lower such ratio.
- The ratio of debt to operating expenses for MGM Resorts International is higher than it is for about 90.81% of US stocks.
- Over the past twelve months, MGM has reported earnings growth of -521.12%, putting it ahead of merely 3.87% of US stocks in our set.
- If you're looking for stocks that are quantitatively similar to MGM Resorts International, a group of peers worth examining would be CAG, DAN, AVTR, PTVE, and WRK.
- MGM's SEC filings can be seen here. And to visit MGM Resorts International's official web site, go to www.mgmresorts.com.
MGM Valuation Summary
- MGM's price/sales ratio is 3.2; this is 128.57% higher than that of the median Consumer Cyclical stock.
- Over the past 243 months, MGM's price/sales ratio has gone up 2.2.
- Over the past 243 months, MGM's EV/EBIT ratio has gone down 63.9.
Below are key valuation metrics over time for MGM.
Stock | Date | P/S | P/B | P/E | EV/EBIT |
---|---|---|---|---|---|
MGM | 2021-08-27 | 3.2 | 3.4 | -17.3 | -52.6 |
MGM | 2021-08-26 | 3.1 | 3.3 | -16.7 | -51.6 |
MGM | 2021-08-25 | 3.1 | 3.3 | -16.8 | -51.7 |
MGM | 2021-08-24 | 3.0 | 3.2 | -16.3 | -50.9 |
MGM | 2021-08-23 | 2.9 | 3.1 | -15.7 | -49.9 |
MGM | 2021-08-20 | 2.8 | 3.0 | -15.3 | -49.1 |
MGM Growth Metrics
- Its year over year net income to common stockholders growth rate is now at -176.87%.
- Its 5 year net cashflow from operations growth rate is now at -6.29%.
- Its 3 year revenue growth rate is now at 23.59%.

The table below shows MGM's growth in key financial areas (numbers in millions of US dollars).
Date | Revenue | Operating Cash Flow | Net Income to Common Stock |
---|---|---|---|
2021-12-31 | 9,680.14 | 1,373.423 | 1,254.37 |
2021-09-30 | 8,116.784 | 643.267 | 675.752 |
2021-06-30 | 6,535.165 | -39.125 | -1,209.412 |
2021-03-31 | 4,557.012 | -1,157.716 | -2,171.422 |
2020-12-31 | 5,162.082 | -1,493.043 | -1,032.724 |
2020-09-30 | 6,853.682 | -795.312 | 1,426.458 |
MGM's Quality Factors
The “Quality” component of the POWR Ratings focuses on 31 different factors of a companies fundamentals and operational strength. Here are some key insights as we drill into the specifics of these quality attributes.- MGM has a Quality Grade of C, ranking ahead of 58.84% of graded US stocks.
- MGM's asset turnover comes in at 0.177 -- ranking 70th of 79 Restaraunts Hotels Motels stocks.
- WYNN, XHR, and PLYA are the stocks whose asset turnover ratios are most correlated with MGM.
The table below shows MGM's key quality metrics over time.
Period | Asset Turnover | Gross Margin | ROIC |
---|---|---|---|
2021-06-30 | 0.177 | 0.432 | -0.016 |
2021-03-31 | 0.123 | 0.354 | -0.045 |
2020-12-31 | 0.138 | 0.331 | -0.012 |
2020-09-30 | 0.186 | 0.352 | 0.061 |
2020-06-30 | 0.255 | 0.375 | 0.078 |
2020-03-31 | 0.355 | 0.401 | 0.114 |
MGM Price Target
For more insight on analysts targets of MGM, see our MGM price target page. And for a list of of all stocks sorted by upside potential based on analyst target price, see our Top Price Target page.
Average Price Target | $48.54 | Average Broker Recommendation | 1.68 (Moderate Buy) |
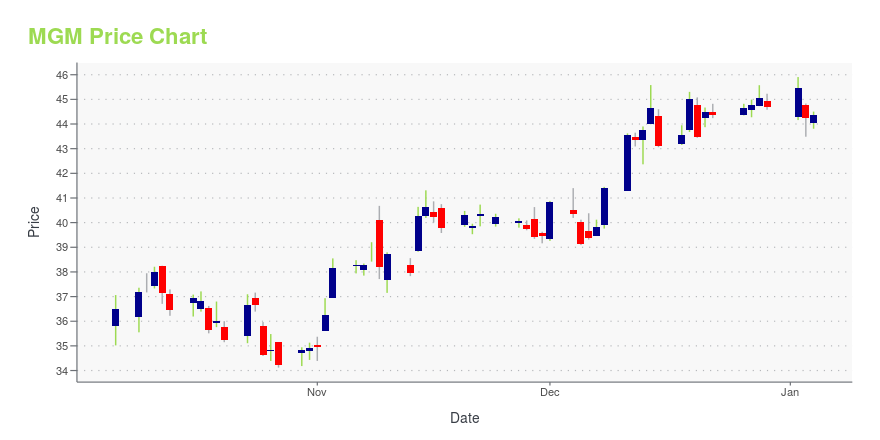
MGM Stock Price Chart Interactive Chart >
MGM Price/Volume Stats
Current price | $34.48 | 52-week high | $51.17 |
Prev. close | $32.09 | 52-week low | $30.70 |
Day low | $32.59 | Volume | 8,254,000 |
Day high | $34.88 | Avg. volume | 5,569,456 |
50-day MA | $39.37 | Dividend yield | 0.03% |
200-day MA | $42.54 | Market Cap | 14.69B |
MGM Resorts International (MGM) Company Bio
MGM Resorts International, headquartered in Las Vegas, Nevada, owns and operates 30 casino, hotel, and entertainment resorts. The company offers its services through its properties in Las Vegas, which include Bellagio, MGM Grand, Mandalay Bay, Mirage, Luxor, and New York-New York. MGM Resorts provide accommodation, dining and gaming services for individuals and families. Since March 24, 2020 MGM Resorts Chief Operating Officer is William (Bill) Hornbuckle. MGM Resort’s main competitors are Caesars Entertainment Inc. (CZR), Las Vegas Sands Corp. (LVS), and Wynn Resorts Ltd. (WYNN). The company has 83,000 employees and made $5.16 billion in revenue in 2020.
Latest MGM News From Around the Web
Below are the latest news stories about MGM Resorts International that investors may wish to consider to help them evaluate MGM as an investment opportunity.
4 Travel Stocks To Buy in March as the Pandemic FadesThese travel stocks should get a big boost during the rest of the year as travel opens up around the world. |
MGM and Caesars Have Huge Plans for the Las Vegas StripBut those two major players will be joined by new casinos, a huge new entertainment venue, and much more. |
A TRULY MAD AFFAIR: CIRQUE DU SOLEIL'S NEW LAS VEGAS SHOW MAD APPLE TO DEBUT AT NEW YORK-NEW YORK HOTEL & CASINO THIS MAYWith nearly four decades at the forefront of groundbreaking entertainment, Cirque du Soleil will debut a completely new and wickedly fun Las Vegas production – Mad Apple – at New York-New York Hotel & Casino on May 26, 2022. Mad Apple will be a delicious Cirque du Soleil cocktail of music, comedy, magic and mayhem that puts NYC nightlife under the Las Vegas lights. |
MGM China Holdings Limited -- Moody's announces completion of a periodic review of ratings of MGM Resorts InternationalAnnouncement of Periodic Review: Moody's announces completion of a periodic review of ratings of MGM Resorts InternationalGlobal Credit Research - 22 Feb 2022New York, February 22, 2022 -- Moody's Investors Service ("Moody's") has completed a periodic review of the ratings of MGM Resorts International and other ratings that are associated with the same analytical unit. The review was conducted through a portfolio review discussion held on 16 February 2022 in which Moody's reassessed the appropriateness of the ratings in the context of the relevant principal methodology(ies), recent developments, and a comparison of the financial and operating profile to similarly rated peers. Since 1 January 2019, Moody's practice has been to issue a press release following each periodic review to ann... |
Overlooked Section of the Iconic Las Vegas Strip Gets a New LifeNew developments, refurbishments, and major projects breathe life into a less popular part of the famous Las Vegas Strip. |
MGM Price Returns
1-mo | -14.53% |
3-mo | -23.58% |
6-mo | -17.60% |
1-year | -21.25% |
3-year | 39.13% |
5-year | 14.18% |
YTD | -23.17% |
2021 | 42.46% |
2020 | -4.57% |
2019 | 39.69% |
2018 | -26.16% |
2017 | 17.48% |
MGM Dividends
Ex-Dividend Date | Type | Payout Amount | Change | ||||||
---|---|---|---|---|---|---|---|---|---|
Loading, please wait... |
Continue Researching MGM
Want to see what other sources are saying about MGM Resorts International's financials and stock price? Try the links below:MGM Resorts International (MGM) Stock Price | Nasdaq
MGM Resorts International (MGM) Stock Quote, History and News - Yahoo Finance
MGM Resorts International (MGM) Stock Price and Basic Information | MarketWatch
Loading social stream, please wait...