MacroGenics, Inc. (MGNX): Price and Financial Metrics

MacroGenics, Inc. (MGNX): $14.96

0.74 (+5.20%)

POWR Rating

Component Grades

Momentum

C

Stability

F

Sentiment

Quality

B

Add MGNX to Watchlist
Sign Up

Industry: Biotech

Industry

F

Ranked

#85 of 363

in industry

MGNX Price/Volume Stats

Current price $14.96 52-week high $21.88
Prev. close $14.22 52-week low $4.29
Day low $14.26 Volume 1,023,700
Day high $14.99 Avg. volume 1,422,842
50-day MA $16.08 Dividend yield N/A
200-day MA $8.68 Market Cap 933.98M

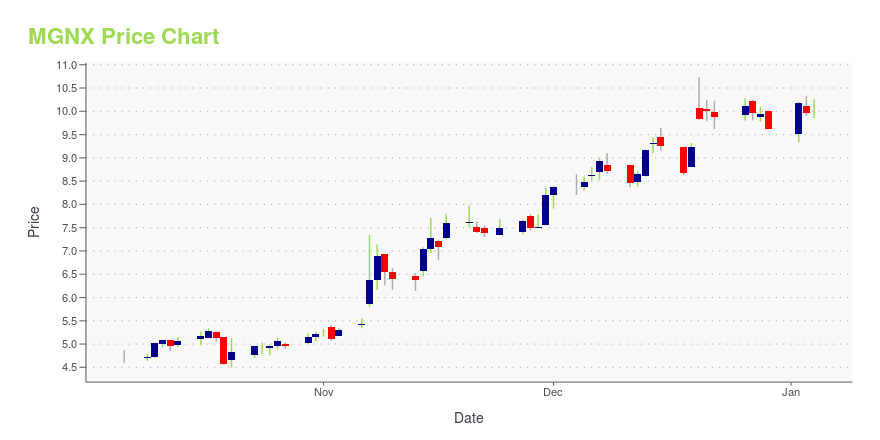
MGNX Stock Price Chart Interactive Chart >

MGNX POWR Grades

  • Value is the dimension where MGNX ranks best; there it ranks ahead of 88.98% of US stocks.
  • The strongest trend for MGNX is in Growth, which has been heading down over the past 26 weeks.
  • MGNX's current lowest rank is in the Growth metric (where it is better than 0.06% of US stocks).

MGNX Stock Summary

  • Of note is the ratio of MACROGENICS INC's sales and general administrative expense to its total operating expenses; only 10.13% of US stocks have a lower such ratio.
  • With a year-over-year growth in debt of 54.89%, MACROGENICS INC's debt growth rate surpasses 87.39% of about US stocks.
  • In terms of twelve month growth in earnings before interest and taxes, MACROGENICS INC is reporting a growth rate of -126.89%; that's higher than merely 10.7% of US stocks.
  • If you're looking for stocks that are quantitatively similar to MACROGENICS INC, a group of peers worth examining would be IKNA, LIFE, ENTA, CRBU, and SYBX.
  • MGNX's SEC filings can be seen here. And to visit MACROGENICS INC's official web site, go to www.macrogenics.com.

MGNX Valuation Summary

  • In comparison to the median Healthcare stock, MGNX's EV/EBIT ratio is 27.4% lower, now standing at 10.6.
  • MGNX's price/sales ratio has moved down 7.4 over the prior 124 months.

Below are key valuation metrics over time for MGNX.

Stock Date P/S P/B P/E EV/EBIT
MGNX 2023-12-29 4.9 3.1 12.0 10.6
MGNX 2023-12-28 5.1 3.2 12.4 10.9
MGNX 2023-12-27 5.1 3.2 12.4 11.0
MGNX 2023-12-26 5.2 3.2 12.6 11.1
MGNX 2023-12-22 5.1 3.2 12.3 10.9
MGNX 2023-12-21 5.1 3.2 12.5 11.0

MGNX Growth Metrics

    The 2 year cash and equivalents growth rate now stands at -49.14%.
  • Its 4 year cash and equivalents growth rate is now at 129.67%.
  • Its 5 year net cashflow from operations growth rate is now at -215.1%.
MGNX's revenue has moved up $28,801,000 over the prior 33 months.

The table below shows MGNX's growth in key financial areas (numbers in millions of US dollars).

Date Revenue Operating Cash Flow Net Income to Common Stock
2022-09-30 92.989 -170.588 -190.582
2022-06-30 66.917 -175.961 -218.655
2022-03-31 71.667 -172.49 -217.286
2021-12-31 77.447 -143.83 -202.115
2021-09-30 115.991 -95.054 -146.18
2021-06-30 118.582 -105.936 -129.337

MGNX's Quality Factors

The “Quality” component of the POWR Ratings focuses on 31 different factors of a companies fundamentals and operational strength. Here are some key insights as we drill into the specifics of these quality attributes.
  • MGNX has a Quality Grade of C, ranking ahead of 36.14% of graded US stocks.
  • MGNX's asset turnover comes in at 0.284 -- ranking 156th of 681 Pharmaceutical Products stocks.
  • SRNE, CNCE, and VBLT are the stocks whose asset turnover ratios are most correlated with MGNX.

The table below shows MGNX's key quality metrics over time.

Period Asset Turnover Gross Margin ROIC
2021-09-30 0.284 0.985 -0.809
2021-06-30 0.294 1.000 -0.724
2021-03-31 0.285 1.000 -0.860
2020-12-31 0.312 1.000 -0.859
2020-09-30 0.242 1.000 -1.055
2020-06-30 0.248 1.000 -1.081

MGNX Price Target

For more insight on analysts targets of MGNX, see our MGNX price target page. And for a list of of all stocks sorted by upside potential based on analyst target price, see our Top Price Target page.

Average Price Target $36.25 Average Broker Recommendation 1.45 (Moderate Buy)

MacroGenics, Inc. (MGNX) Company Bio


Macrogenics is a clinical-stage biopharmaceutical company focused on discovering and developing innovative monoclonal antibody-based therapeutics for the treatment of cancer, as well as autoimmune disorders and infectious diseases. The company was founded in 2000 and is based in Rockville, Maryland.


MGNX Latest News Stream


Event/Time News Detail
Loading, please wait...

MGNX Latest Social Stream


Loading social stream, please wait...

View Full MGNX Social Stream

Latest MGNX News From Around the Web

Below are the latest news stories about MACROGENICS INC that investors may wish to consider to help them evaluate MGNX as an investment opportunity.

7 Undervalued Biotech Stocks That are Flying Under the Clinical Radar

With so many innovative firms skyrocketing this year, astute investors seeking compelling discounts may want to turn their attention to undervalued biotech picks.

Josh Enomoto on InvestorPlace | December 17, 2023

Shareholders in MacroGenics (NASDAQ:MGNX) are in the red if they invested three years ago

It is a pleasure to report that the MacroGenics, Inc. ( NASDAQ:MGNX ) is up 74% in the last quarter. But that doesn't...

Yahoo | December 12, 2023

Q3 2023 MacroGenics Inc Earnings Call

Q3 2023 MacroGenics Inc Earnings Call

Yahoo | November 7, 2023

MacroGenics, Inc. (NASDAQ:MGNX) Q3 2023 Earnings Call Transcript

MacroGenics, Inc. (NASDAQ:MGNX) Q3 2023 Earnings Call Transcript November 7, 2023 Operator: Good afternoon. We will begin the MacroGenics 2023 Third Quarter Corporate Progress and Financial Results Conference Call in just a moment. [Operator Instructions] At this point, I will turn the call over to Jim Karrels, Senior Vice President and Chief Financial Officer of […]

Yahoo | November 7, 2023

MacroGenics (MGNX) Q3 2023 Earnings Call Transcript

At this point, I will turn the call over to Jim Karrels, senior vice president and chief financial officer of MacroGenics. Good afternoon and welcome to MacroGenics conference call to discuss our third quarter 2023 financial and operational results.

Yahoo | November 7, 2023

Read More 'MGNX' Stories Here

MGNX Price Returns

1-mo -13.33%
3-mo 55.51%
6-mo 221.03%
1-year 106.63%
3-year -52.84%
5-year -16.80%
YTD 55.51%
2023 43.37%
2022 -58.19%
2021 -29.79%
2020 110.11%
2019 -14.33%

Get Free Updates

Join thousands of investors who get the latest news, insights and top rated picks from StockNews.com!