
MGT Capital Investments Inc. (MGTI): Price and Financial Metrics
MGTI Price/Volume Stats
| Current price | $0.00 | 52-week high | $0.01 |
| Prev. close | $0.00 | 52-week low | $0.00 |
| Day low | $0.00 | Volume | 251,233 |
| Day high | $0.00 | Avg. volume | 1,666,960 |
| 50-day MA | $0.00 | Dividend yield | N/A |
| 200-day MA | $0.00 | Market Cap | 228.13K |
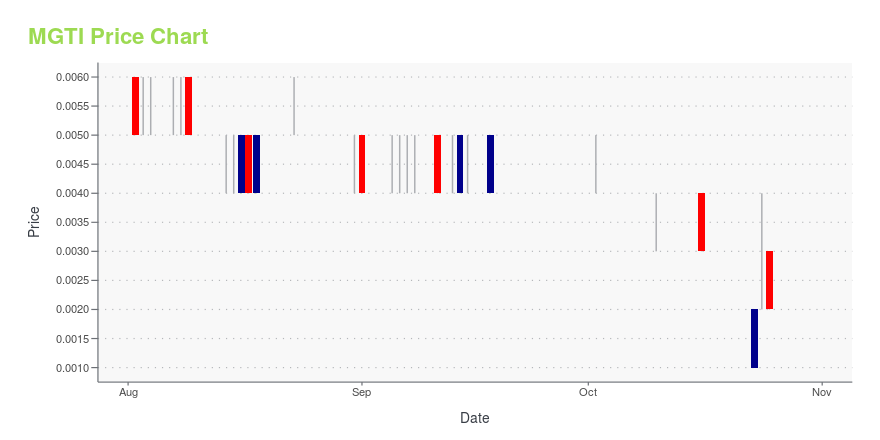
MGTI Stock Price Chart Interactive Chart >
MGT Capital Investments Inc. (MGTI) Company Bio
MGT Capital Investments, Inc. engages in the cryptocurrency mining business. It owns and operates Bitmain Antminer S9 Bitcoin mining rigs and graphics processing unit-based Ethereum miners. The company was founded in 1977 and is headquartered in Raleigh, NC.
Latest MGTI News From Around the Web
Below are the latest news stories about MGT CAPITAL INVESTMENTS INC that investors may wish to consider to help them evaluate MGTI as an investment opportunity.
BIT5IVE LLC and MGT Capital Announce Letter of Intent to MergeMGT Capital Investments, Inc. (OTCQB: MGTI) today announced the execution of a non-binding letter of intent to merge with Bit5ive LLC in a stock swap MGT believes will benefit stockholders of both companies. Subject to the execution of a definitive agreement and certain closing conditions -- including the completion of Bit5ive's financial audit and approval by Bit5ive's members – the transaction will create a strong competitor in the design and operation of infrastructure used in the Bitcoin min |
MGTI Price Returns
| 1-mo | 0.00% |
| 3-mo | 0.00% |
| 6-mo | 0.00% |
| 1-year | 0.00% |
| 3-year | 0.00% |
| 5-year | 0.00% |
| YTD | 0.00% |
| 2023 | -9.52% |
| 2022 | -74.55% |
| 2021 | -58.75% |
| 2020 | 122.22% |
| 2019 | -66.29% |
Continue Researching MGTI
Want to do more research on Mgt Capital Investments Inc's stock and its price? Try the links below:Mgt Capital Investments Inc (MGTI) Stock Price | Nasdaq
Mgt Capital Investments Inc (MGTI) Stock Quote, History and News - Yahoo Finance
Mgt Capital Investments Inc (MGTI) Stock Price and Basic Information | MarketWatch
Loading social stream, please wait...